Newsroom
86
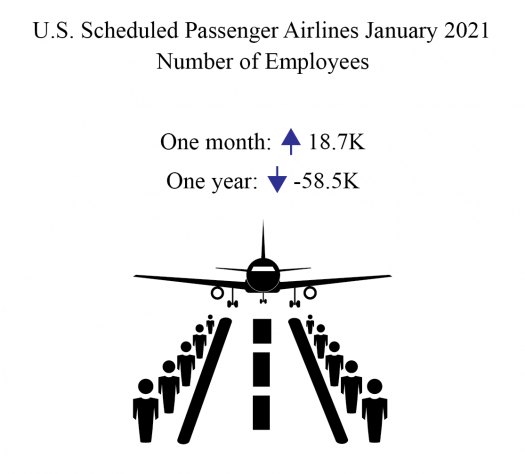
Mid-January 2021 U.S. Passenger Airline Employment Up Nearly 19,000 FTEs from Mid-December
Release Number: BTS 20-21
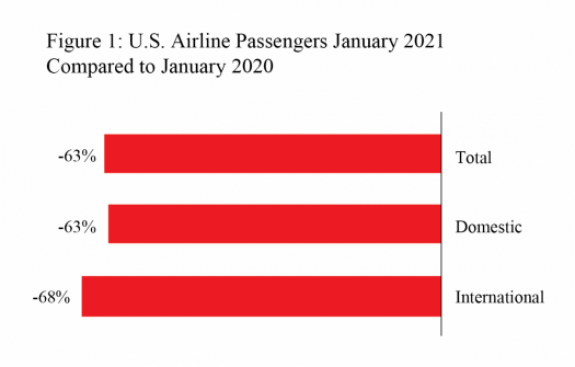
U.S. Airlines January 2021 Passengers Decreased 63% from January 2020 (Preliminary)
Release Number: BTS 19-21
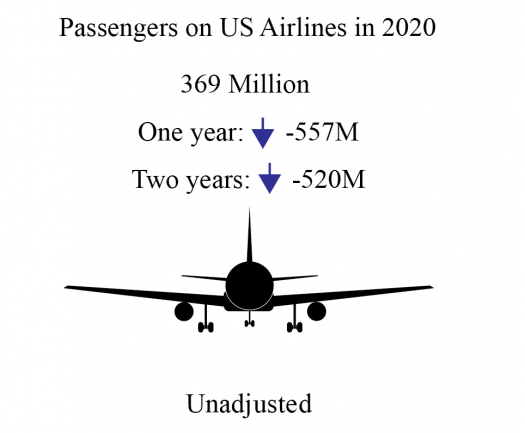
Full Year 2020 and December 2020 U.S. Airline Traffic Data
Release Number: BTS 18-21