
Newsroom
86
Port Performance Freight Statistics Annual Report
Port Performance Freight Statistics in 2019, Annual Report to Congress 2020, a congressionally-mandated report, is now available from the Bureau of Transportation Statistics (BTS). This edition is the fifth annual report from the BTS Port Performance Freight Statistics Program established by the...Mid-November 2020 U.S. Passenger Airline Employment Down More Than 1,400 FTEs from Mid-October
Release Number: BTS 04-21
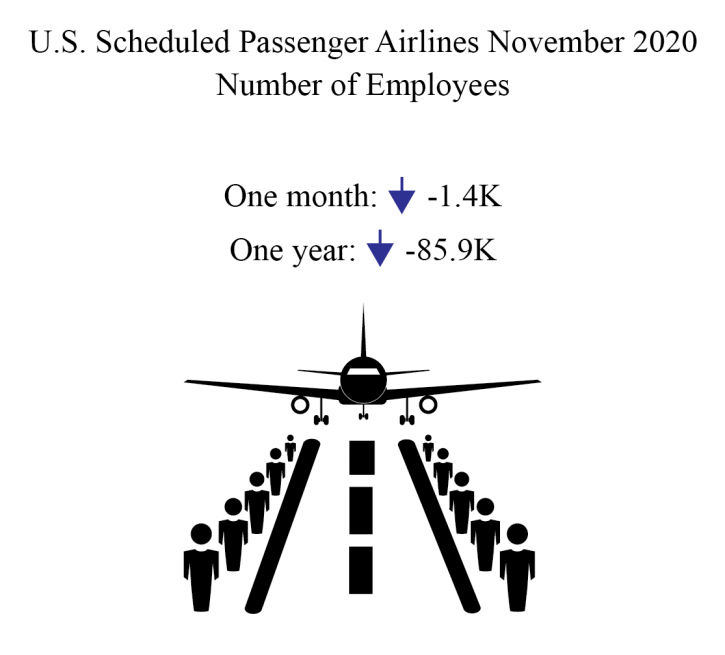
The 20 U.S. scheduled passenger airlines employed 0.4% fewer full-time equivalents (FTEs) in mid-November 2020 than in mid-October 2020: