
Economics, employment, and finance
Legacy ID
1546
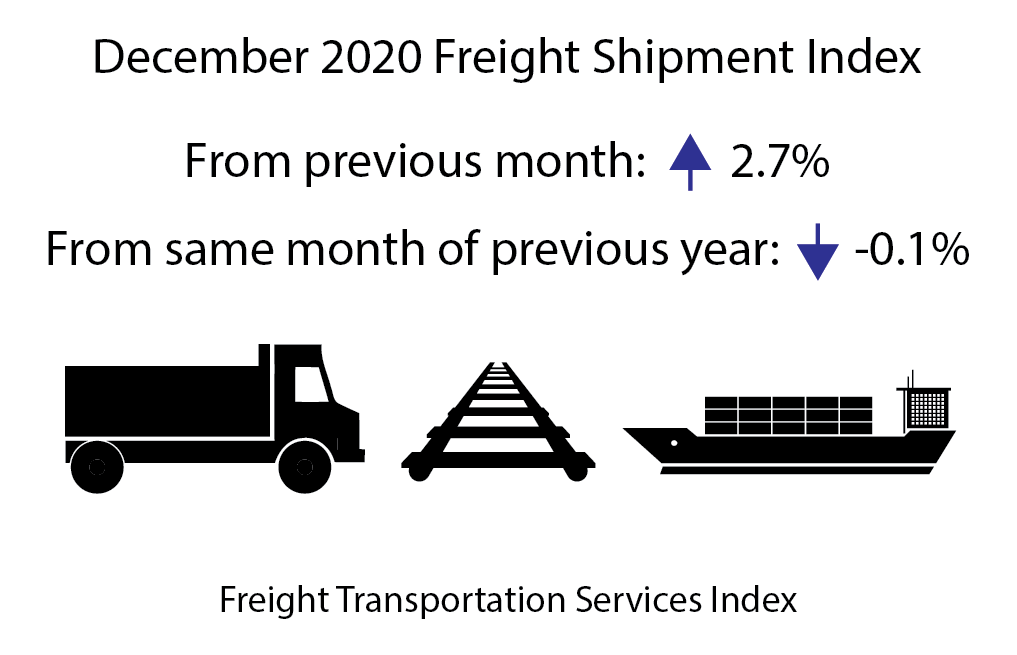
December 2020 Freight Transportation Services Index (TSI) Rose to Highest Level since Start of Pandemic
Release Number: BTS 09-21
Transportation Expenditure Trends by Level of Government and Mode
Interactive visualization:
Own-Source and Supporting Revenue Allocated for Transportation
Interactive visualization:
Revenue Allocated for Transportation by Level of Government and Mode
Interactive visualization:
VIUS FAQs
What is the purpose of the Vehicle Inventory and Use Survey (VIUS)? Will the scope and population of interest for the 2021 VIUS remain the same as the earlier surveys? What are some common uses of the VIUS data? Who uses the VIUS data? Who conducts the VIUS and how often is it...Post-CARES Act: U.S. Passenger Airlines Drop Nearly 37,000 Jobs in October 2020 from September
Airlines receiving funds under the CARES Act were prohibited from layoffs or furloughs until Sept. 30. The 22 U.S. scheduled passenger airlines employed 9.1% fewer full-time equivalents (FTEs) in mid-October 2020 than in mid-September 2020: