
Annual and Fourth-Quarter 2018 Air Fare Data
The 2018 average domestic itinerary air fare of $350 was the lowest inflation-adjusted annual fare since the Bureau of Transportation Statistics began collecting such records in 1995, down 1.8 percent from the previous low of $356 in 2017.
In the fourth quarter of the year, fares turned up to $359, reaching the highest quarterly level since the second quarter of 2017 ($367). The fourth-quarter 2018 average domestic itinerary air fare was up 4.7% from in the third quarter of 2018 ($343), which was the lowest quarter on record, adjusted for inflation, and up 1.2% from the fourth quarter of 2017.
Annual Air Fares
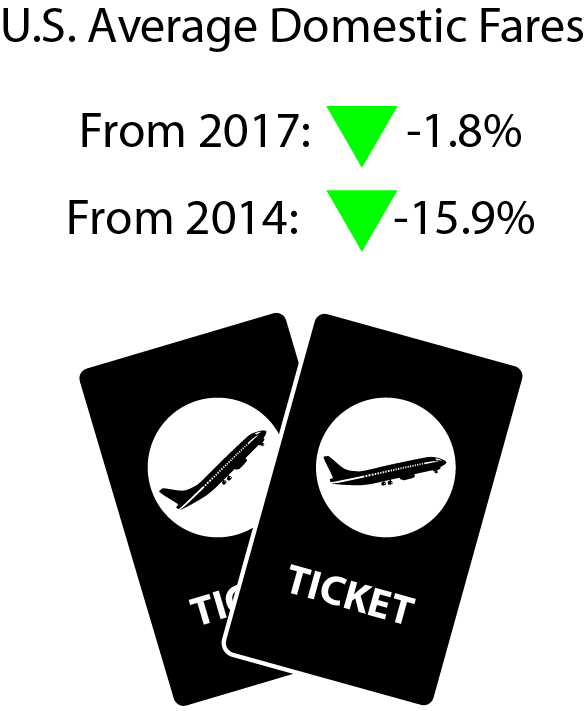
Figure 1. U.S. Average Domestic Annual Fares, 1995-2018
| Unadjusted Fares (current dollars) | Inflation-Adjusted (2018 $) | 1 | |
|---|---|---|---|
| 1995 | 292 | 481 | 2 |
| 1996 | 277 | 443 | 3 |
| 1997 | 287 | 449 | 4 |
| 1998 | 309 | 476 | 5 |
| 1999 | 324 | 488 | 6 |
| 2000 | 339 | 494 | 7 |
| 2001 | 321 | 455 | 8 |
| 2002 | 312 | 436 | 9 |
| 2003 | 315 | 430 | 10 |
| 2004 | 305 | 406 | 11 |
| 2005 | 307 | 395 | 12 |
| 2006 | 329 | 409 | 13 |
| 2007 | 325 | 394 | 14 |
| 2008 | 346 | 404 | 15 |
| 2009 | 310 | 363 | 16 |
| 2010 | 336 | 387 | 17 |
| 2011 | 364 | 406 | 18 |
| 2012 | 375 | 410 | 19 |
| 2013 | 382 | 412 | 20 |
| 2014 | 392 | 416 | 21 |
| 2015 | 377 | 399 | 22 |
| 2016 | 349 | 365 | 23 |
| 2017 | 348 | 356 | 24 |
| 2018 | 350 | 350 | 25 |
| 26 |
Bureau of Transportation Statistics, Origin and Destination Survey
Other Revenue: In recent years, airlines obtained additional revenue from passenger fees, as well as from other sources. U.S. passenger airlines collected 74.0% of total operating revenue of $140.7 billion from passenger fares during the first nine months of 2018, down from 87.6% in 1995.
Fourth Quarter Air Fares
Fares by Airport
Figure 2. Fares by Airport Group based on Number of Originating Domestic Passengers 4Q 2018
| Originating Domestic Passengers | 4Q Fares (current dollars) | 1 | |||
|---|---|---|---|---|---|
| 2M+ | 366 | 2 | |||
| 1.5M-2M | 358 | 3 | |||
| 1M-1.5M | 339 | 4 | |||
| 500K-1M | 350 | 5 |
Bureau of Transportation Statistics, Origin and Destination Survey
Additional data: see Top 100 Airports or All Airports. First Quarter 2019 average fare data will be released July 16.
Standard error: Results for average fares are based on the BTS Origin & Destination Survey, a 10% sample of airline tickets used during the quarter. Averages for airports with smaller samples may be less reliable.
Note: Results for average fares are based on the BTS Origin & Destination Survey, a 10 percent sample of airline tickets used during the quarter. For results based on all itinerary fares, the standard error is 0.28. The 90% confidence interval ranges from $358.84 to $359.76. For results based on round-trip fares, the standard error is 0.33. The 90% confidence interval ranges from $430.14 to $431.21. For results based on one-way fares, the standard error is 0.37. The 90% confidence interval ranges from $256.24 to $257.47.