Third-Quarter 2018 Air Fare Data
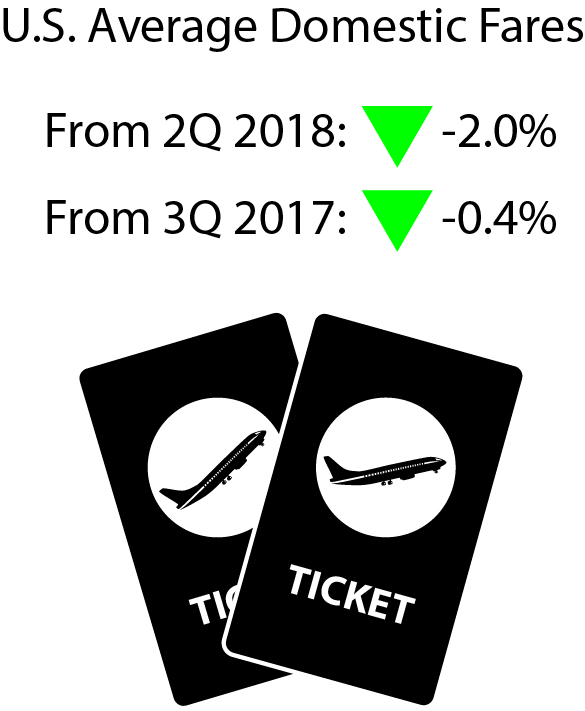
The third quarter 2018 average domestic itinerary air fare of $343 is the lowest inflation-adjusted quarterly fare since the Bureau of Transportation Statistics began collecting such records in 1995, down 0.4 percent from the previous low of $345 in the third quarter of 2017.
- Down 0.4 percent from 3Q 2017 ($345)
- Down 2.0 percent from 2Q 2018 ($350)

Inflation-Adjusted Air Fares (Constant 2018 dollars)
Figure 1. U.S. Average Domestic Fares, 3rd Quarter 1995-2018
| Unadjusted 3Q Fares (current dollars) | Inflation-Adjusted 3Q Fares (2018 $) | 1 | |
|---|---|---|---|
| 1995 | 292 | 482 | 2 |
| 1996 | 277 | 443 | 3 |
| 1997 | 287 | 450 | 4 |
| 1998 | 309 | 477 | 5 |
| 1999 | 324 | 488 | 6 |
| 2000 | 339 | 494 | 7 |
| 2001 | 321 | 455 | 8 |
| 2002 | 312 | 436 | 9 |
| 2003 | 315 | 431 | 10 |
| 2004 | 305 | 406 | 11 |
| 2005 | 307 | 394 | 12 |
| 2006 | 329 | 407 | 13 |
| 2007 | 325 | 394 | 14 |
| 2008 | 346 | 398 | 15 |
| 2009 | 310 | 363 | 16 |
| 2010 | 336 | 388 | 17 |
| 2011 | 364 | 405 | 18 |
| 2012 | 375 | 409 | 19 |
| 2013 | 382 | 412 | 20 |
| 2014 | 392 | 415 | 21 |
| 2015 | 372 | 393 | 22 |
| 2016 | 344 | 360 | 23 |
| 2017 | 336 | 345 | 24 |
| 2018 | 343 | 343 | 25 |
| 26 |
Bureau of Transportation Statistics, Origin and Destination Survey
Other Revenue: In recent years, airlines obtained additional revenue from passenger fees, as well as from other sources. U.S. passenger airlines collected 74.0 percent of total operating revenue of $140.7 billion from passenger fares during the first nine months of 2018, down from 87.6 percent in 1995.
Fares by Airport
Figure 2. Fares by Airport Group based on Number of Originating Domestic Passengers 3Q 2018
| Originating Domestic Passengers | 3Q Fares (current dollars) | 1 | |||
|---|---|---|---|---|---|
| 2M+ | 346 | 2 | |||
| 1.5M-2M | 314 | 3 | |||
| 1M-1.5M | 331 | 4 | |||
| 500K-1M | 338 | 5 |
Bureau of Transportation Statistics, Origin and Destination Survey
Standard error: Results for average fares are based on the BTS Origin & Destination Survey, a 10 percent sample of airline tickets used during the quarter. Averages for airports with smaller samples may be less reliable.
Note: Results for average fares are based on the BTS Origin & Destination Survey, a 10 percent sample of airline tickets used during the quarter. For results based on all itinerary fares, the standard error is 0.28. The 90 percent confidence interval ranges from $342.83 to $343.74. For results based on round-trip fares, the standard error is 0.32. The 90 percent confidence interval ranges from $416.76 to $417.83. For results based on one-way fares, the standard error is 0.34. The 90 percent confidence interval ranges from $248.68 to $249.80.
