
Air Cargo Between the U.S. and World Regions, including China, February 2020 (Preliminary)
Airlines carried 7.3% less cargo by weight between the U.S. and foreign points in February 2020 than in February 2019, according to data filed with the Bureau of Transportation Statistics (BTS) by large air carriers.
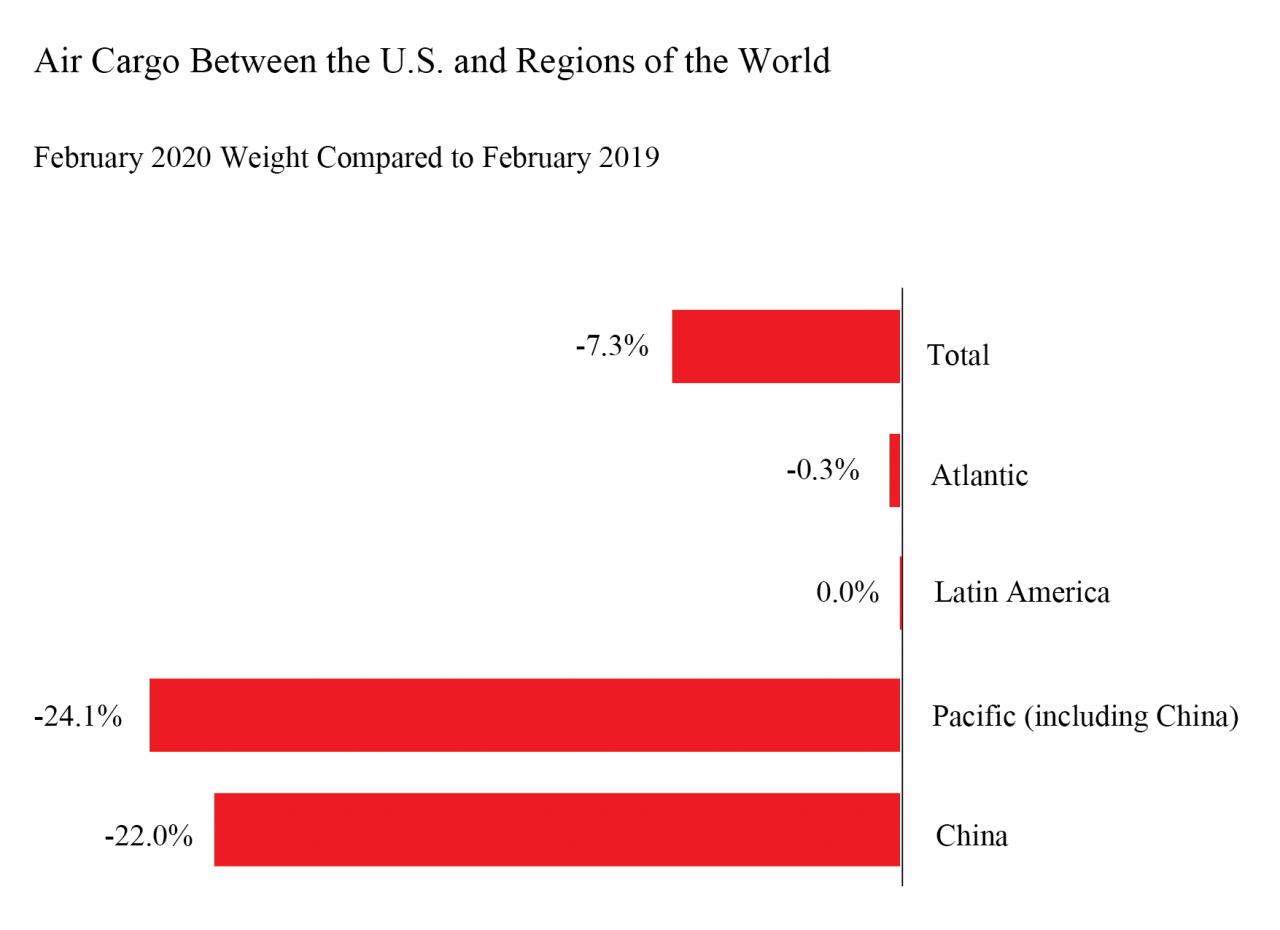
February 2020 cargo numbers by world geographic regions (by weight):
- Total: 593 thousand tons, down 7.3% from February 2019 (640T tons)
- Atlantic: 99.0 thousand tons, down 0.3% from February 2019 (99.3T tons)
- Latin America: 50 thousand tons, unchanged from February 2019 (50T tons)
- Pacific (including China): 60 thousand tons, down 24% from February 2019 (79T tons)
- China: 44 thousand tons, down 22% from February 2019 (57T tons)
Air cargo reports are filed monthly with BTS. Final February data will be released on May 14. Complete international data by origin and destination will be released on Aug. 13. Cargo data in this release consists of cargo carried between the U.S. and foreign points.
Total Cargo to and from the U.S.
February 2020 would be the 16th consecutive month that the weight of cargo carried on U.S. and foreign airlines between the U.S. and foreign points declined from the same month of the previous year. The year-to-year decline of 7.3% from February 2019 would be a larger decrease than the 6.1% decline from January 2019 to January 2020.
| 2016-2017 | 2017-2018 | 2018-2019 | 2019-2020 | |
|---|---|---|---|---|
| January | 7.4 | 13.3 | -2.1 | -6.1 |
| February | 6.3 | 14.2 | -4.5 | -7.3* |
| March | 10.0 | 11.7 | -1.9 | |
| April | 6.3 | 13.0 | -10.0 | |
| May | 10.9 | 12.3 | -6.5 | |
| June | 11.1 | 9.3 | -7.7 | |
| July | 11.9 | 4.4 | -8.4 | |
| August | 13.3 | 4.7 | -5.3 | |
| September | 9.5 | 5.8 | -10.6 | |
| October | 13.9 | 1.2 | -11.8 | |
| November | 20.2 | -9.4 | -4.0 | |
| December | 14.5 | -2.2 | -8.6 | |
| Annual | 11.5 | 5.9 | -6.9 |
Atlantic Region Cargo
February 2020 would be the 17th consecutive month that the weight of cargo carried on U.S. and foreign airlines between the U.S. and the Atlantic region declined from the same month of the previous year. The year-to-year decline of 0.3% from February 2019 would be the smallest decrease in those 17 months.
| 2016-2017 | 2017-2018 | 2018-2019 | 2019-2020 | |
|---|---|---|---|---|
| January | 10.5 | 7.4 | -3.3 | -5.8 |
| February | 6.3 | 7.0 | -1.2 | -0.3* |
| March | 15.2 | 7.5 | -5.3 | |
| April | 10.8 | 3.2 | -7.3 | |
| May | 18.3 | 0.9 | -7.5 | |
| June | 16.7 | 3.0 | -13.6 | |
| July | 15.1 | -1.5 | -9.9 | |
| August | 14.6 | 1.0 | -9.9 | |
| September | 8.3 | 1.1 | -15.3 | |
| October | 12.0 | -1.9 | -12.5 | |
| November | 12.4 | -4.7 | -7.5 | |
| December | 5.3 | -2.3 | -10.1 | |
| Annual | 12.1 | 1.6 | -8.8 |
Latin America Region
Cargo by weight between the U.S. and Latin America was unchanged in February 2020 from February 2019 after three consecutive year-to-year declines. Previously, U.S.-Latin America cargo declined from the same month of the previous year in 15 of the 18 months through January 2020.
| 2016-2017 | 2017-2018 | 2018-2019 | 2019-2020 | |
|---|---|---|---|---|
| January | 0.6 | 12.3 | -3.8 | -5.0 |
| February | 8.3 | 11.5 | -6.9 | 0.0* |
| March | 14.3 | 5.8 | -6.2 | |
| April | 4.0 | 16.9 | -29.6 | |
| May | 2.6 | -11.9 | 17.4 | |
| June | -0.1 | 0.3 | -3.7 | |
| July | -20.9 | 24.8 | -5.8 | |
| August | -1.8 | -3.0 | -3.1 | |
| September | -7.9 | 1.7 | -6.1 | |
| October | 40.8 | -13.2 | -10.5 | |
| November | 7.3 | -9.1 | 0.1 | |
| December | 10.2 | -4.0 | -6.4 | |
| Annual | 4.1 | 1.6 | -5.8 |
Pacific Region (including China)
February 2020 would be the 13th consecutive month that the weight of cargo carried on U.S. and foreign airlines between the U.S. and the Pacific region declined from the same month of the previous year. The 24% decline from February 2019 would be the largest year-to-year decline during that time.
| 2016-2017 | 2017-2018 | 2018-2019 | 2019-2020 | |
|---|---|---|---|---|
| January | 17.1 | 6.5 | 0.7 | -7.3 |
| February | 20.0 | 0.7 | -7.3 | -24.1* |
| March | 10.3 | -0.1 | -2.5 | |
| April | 8.1 | -0.1 | -4.1 | |
| May | 10.8 | 0.5 | -2.8 | |
| June | 12.9 | 1.4 | -4.8 | |
| July | 11.3 | 3.6 | -3.5 | |
| August | 10.5 | 4.2 | -5.3 | |
| September | 11.4 | 2.0 | -18.1 | |
| October | 1.1 | 4.2 | -18.8 | |
| November | 7.0 | -1.8 | -20.7 | |
| December | 7.8 | -0.8 | -5.9 | |
| Annual | 10.2 | 1.6 | -7.9 |
China
February 2020 would be the third consecutive month and the 15th out of 16 months that the weight of cargo carried on U.S. and foreign airlines between the U.S. and China declined from the same month of the previous year. The 22% decline from February 2019 would be the largest year-to-year decline during that time. During February 2020, 69% of the freight was flown from China to the U.S. while 31% was carried from the U.S. to China.
| 2016-2017 | 2017-2018 | 2018-2019 | 2019-2020 | |
|---|---|---|---|---|
| January | 6.2 | 30.1 | -2.0 | -11.8 |
| February | 20.8 | 20.0 | -10.9 | -22.0* |
| March | 8.5 | 21.4 | -1.6 | |
| April | 15.7 | 14.4 | -1.5 | |
| May | 24.3 | 16.3 | -4.7 | |
| June | 19.9 | 17.9 | -4.0 | |
| July | 31.2 | 9.3 | -9.2 | |
| August | 18.8 | 21.2 | -6.9 | |
| September | 18.8 | 18.6 | -10.0 | |
| October | 19.1 | 6.2 | -7.2 | |
| November | 13.5 | -6.8 | 2.9 | |
| December | 20.1 | 2.4 | -3.8 | |
| Annual | 17.9 | 13.2 | -4.4 |
China Air Cargo to U.S. Cities
Los Angeles was top city for air cargo shipments by weight from China in February 2019 but it would be surpassed by Chicago and Anchorage, Alaska, in February 2020.
| US Cities | February 2019 | February 2020 |
|---|---|---|
| Los Angeles, CA | 22,604,244 | 14,618,032 |
| Anchorage, AK | 19,206,323 | 18,170,862 |
| Chicago, IL | 18,342,982 | 22,685,195 |
| New York, NY | 6,986,832 | 3,892,925 |
| San Francisco, CA | 3,386,287 | 268,109 |
| Memphis, TN | 3,155,447 | * |
| Atlanta, GA | 2,263,624 | 23,186 |
| Dallas/Fort Worth, TX | 1,758,327 | * |
| Oakland, CA | 1,426,440 | * |
| Newark, NJ | 1,210,869 | * |
| Houston, TX | 1,090,742 | * |
| Washington, DC | 978,192 | * |
| Detroit, MI | 900,431 | * |
| Seattle, WA | 784,261 | 62,131 |
| Boston, MA | 337,331 | * |
| San Jose, CA | 199,278 | * |
| Honolulu, HI | 107,967 | * |
| Denver, CO | 106,656 | * |
Note: February 2020 data is withheld due to confidentiality restrictions if fewer than three airlines provide service to the city
Reporting Notes
Data are compiled from monthly reports filed with BTS by commercial U.S. air carriers detailing operations, passenger traffic and cargo traffic. This release includes data received by BTS from 15 U.S. airlines as of April 17.
See the BTS Airlines and Airports page for additional U.S. airlines numbers through January for U.S. airlines. International data by origin and destination is available through October.
BTS has scheduled May 14 for the release of reported data through February.
None of the data are from samples. Measures of statistical significance do not apply to the complete air traffic data.