
Air Traffic Data, May 2020: 89% Reduction in U.S. Airline Passengers from May 2019 (Preliminary)
U.S. airlines carried 89% fewer scheduled service passengers in May 2020 than in May 2019, according to data filed with the Bureau of Transportation Statistics (BTS) by 20 airlines that carry more than 90% of the passengers. Despite the large drop from May 2019, U.S. airlines carried more than twice as many passengers in May 2020 than in April 2020.
The 89% decline in the number of passengers would be the second largest year-to-year decrease following the 96% decline from April 2019 to April 2020.
The large airlines carried 7.9 million passengers in May 2020, up from 3.0 million passengers on all U.S. airlines in April, which was the lowest monthly total in BTS records dating back to 1974. The previous low was 14.6 million passengers in February 1975.
Preliminary May 2020 passenger numbers (20 carriers reporting):
- Total: 7.9 million passengers, down 89% from May 2019 (74.8M)
- Domestic: 7.8 million passengers, down 88% from May 2019 (65.3M)
- International: 182 thousand passengers, down 98% from May 2019 (9.9M)
U.S. airline traffic reports are filed monthly with BTS. Final May data will be released on Aug. 13. Complete international data by origin and destination, which is under a six-month confidentiality restriction, will be released on Nov. 13.
Systemwide Passengers
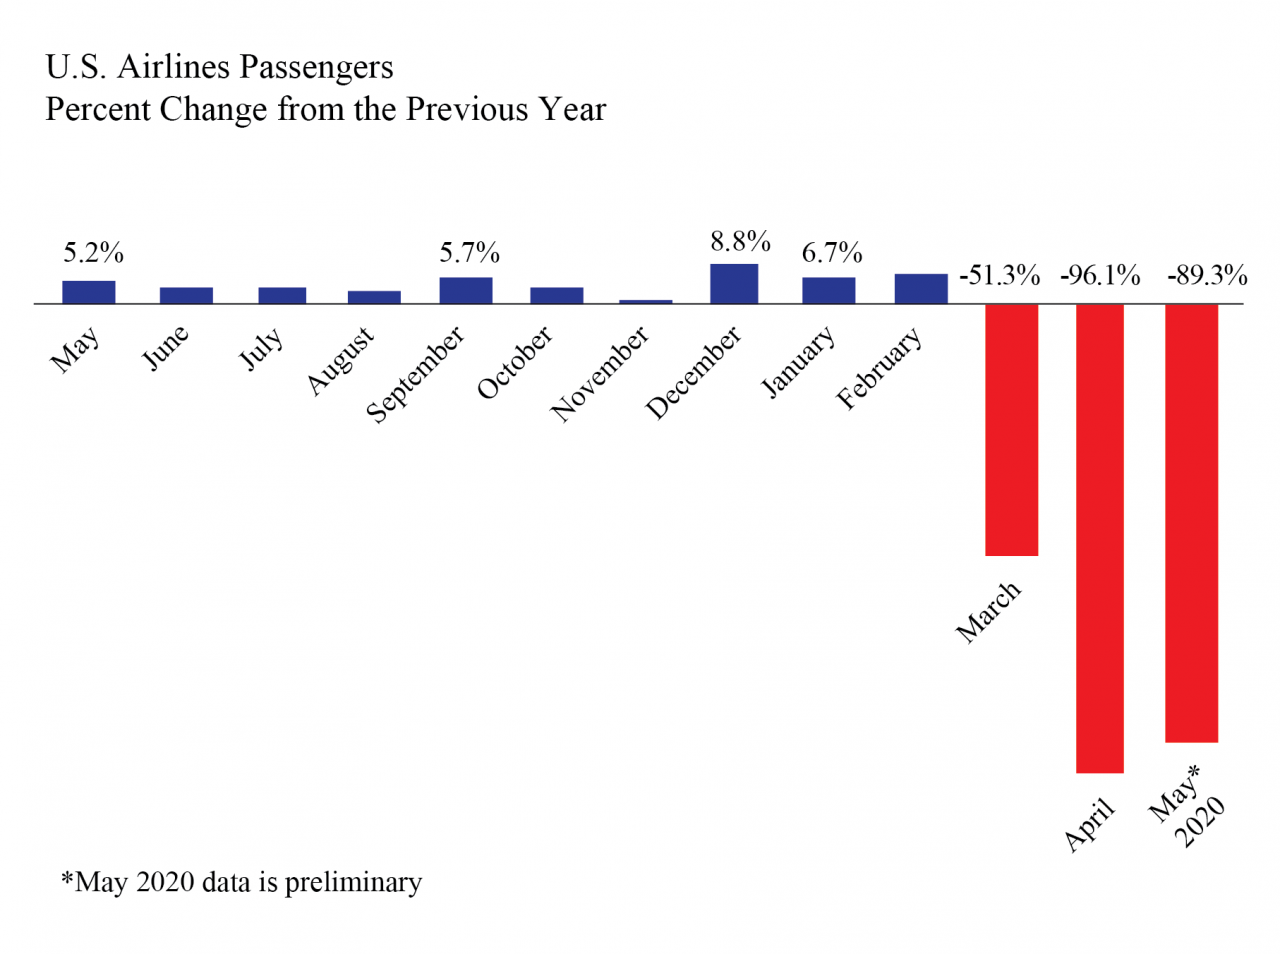
With the 89% drop in U.S. airlines passengers from May 2019 to May 2020 the number of passengers on U.S. airlines fell to the second lowest monthly level on record based on records since 1974. April 2020 was the lowest level. The decline beginning in March followed 29 consecutive months of increases from the same month of the previous year, dating back to October 2017.
2016-2017 | 2017-2018 | 2018-2019 | 2019-2020 | |
|---|---|---|---|---|
January | 3.0 | 2.9 | 4.0 | 5.6 |
February | -0.2 | 5.7 | 3.0 | 6.7 |
March | 3.4 | 4.6 | 5.1 | -51.3 |
April | 4.5 | 4.8 | 3.8 | -96.1 |
May | 3.0 | 4.9 | 5.2 | -89.3* |
June | 3.4 | 5.0 | 3.7 | |
July | 3.8 | 5.2 | 3.6 | |
August | 5.0 | 5.0 | 3.4 | |
September | -2.3 | 5.8 | 5.7 | |
October | 4.6 | 3.9 | 4.1 | |
November | 4.6 | 4.5 | 0.5 | |
December | 3.5 | 3.6 | 8.8 | |
| Annual | 3.1 | 4.7 | 4.2 |
Domestic Passengers
Domestic passengers on U.S. airlines declined 88% from May 2019 to May 2020, compared to a 96% decline from April 2019 to April 2020. The number of domestic passengers rose year-to-year for 29 consecutive months beginning in October 2017 before the 51% decline in March.
2016-2017 | 2017-2018 | 2018-2019 | 2019-2020 | |
|---|---|---|---|---|
January | 3.1 | 3.2 | 3.9 | 6.2 |
February | -0.1 | 5.9 | 3.0 | 7.4 |
March | 3.8 | 4.2 | 5.4 | -51.0 |
April | 3.7 | 5.7 | 3.7 | -95.7 |
May | 2.7 | 5.3 | 5.2 | -88.1* |
June | 3.1 | 5.3 | 3.6 | |
July | 3.7 | 5.8 | 3.8 | |
August | 5.0 | 5.5 | 3.4 | |
September | -2.5 | 5.8 | 5.8 | |
October | 4.7 | 3.8 | 4.2 | |
November | 4.5 | 4.4 | 0.2 | |
December | 3.7 | 3.7 | 9.5 | |
| Annual | 3.0 | 4.9 | 4.3 |
International Passengers
The number of U.S. airlines international passengers declined 98% from May 2019 to May 2020, after a 99% decrease from April 2019 to April 2020. In May 2020, the large airlines carried 182,000 passengers compared to 132,000 in April 2020. The declines beginning in March followed 22 consecutive months of increases from the same month of the previous year, dating back to May 2018.
2016-2017 | 2017-2018 | 2018-2019 | 2019-2020 | |
|---|---|---|---|---|
January | 2.1 | 1.0 | 4.5 | 1.9 |
February | -1.2 | 4.6 | 3.4 | 0.7 |
March | 0.4 | 7.2 | 3.1 | -53.3 |
April | 9.8 | -1.0 | 4.3 | -98.6 |
May | 5.4 | 2.3 | 5.6 | -98.1* |
June | 5.3 | 3.4 | 4.2 | |
July | 4.6 | 1.6 | 2.2 | |
August | 4.9 | 2.0 | 3.9 | |
September | -1.1 | 5.9 | 4.6 | |
October | 3.2 | 4.3 | 3.2 | |
November | 5.4 | 4.7 | 2.2 | |
December | 1.7 | 3.2 | 3.6 | |
| Annual | 3.5 | 3.1 | 3.8 |
Reporting Notes
Data are compiled from monthly reports filed with BTS by commercial U.S. air carriers detailing operations, passenger traffic and freight traffic. This release includes data received by BTS from 20 U.S. airlines as of July 2.
See the BTS Airlines and Airports page for additional U.S. airlines numbers through March for U.S. airlines. International data by origin and destination is available through December.
BTS has scheduled July 16 for the release of final reported data for April.
None of the data are from samples. Measures of statistical significance do not apply to the complete air traffic data.