
Annual Rise in U.S. Airlines July Cargo (13%) Largest Increase in a Decade
U.S. airlines carried almost 13% more cargo by weight in July 2020 (preliminary) than in July 2019, the largest annual increase since 2010. The rise was fueled by a gain of almost 16% in domestic cargo while the 4.5% rise in international cargo was the first annual gain since March 2019, according to data filed with the Bureau of Transportation Statistics (BTS) by 15 of the leading cargo airlines.
The 15 airlines carry 97% of the total cargo by weight on U.S. airlines. Cargo data consists of freight and mail carried within the U.S. and between the U.S. and foreign points.
July 2020 (preliminary) air cargo numbers for 15 U.S. carriers:
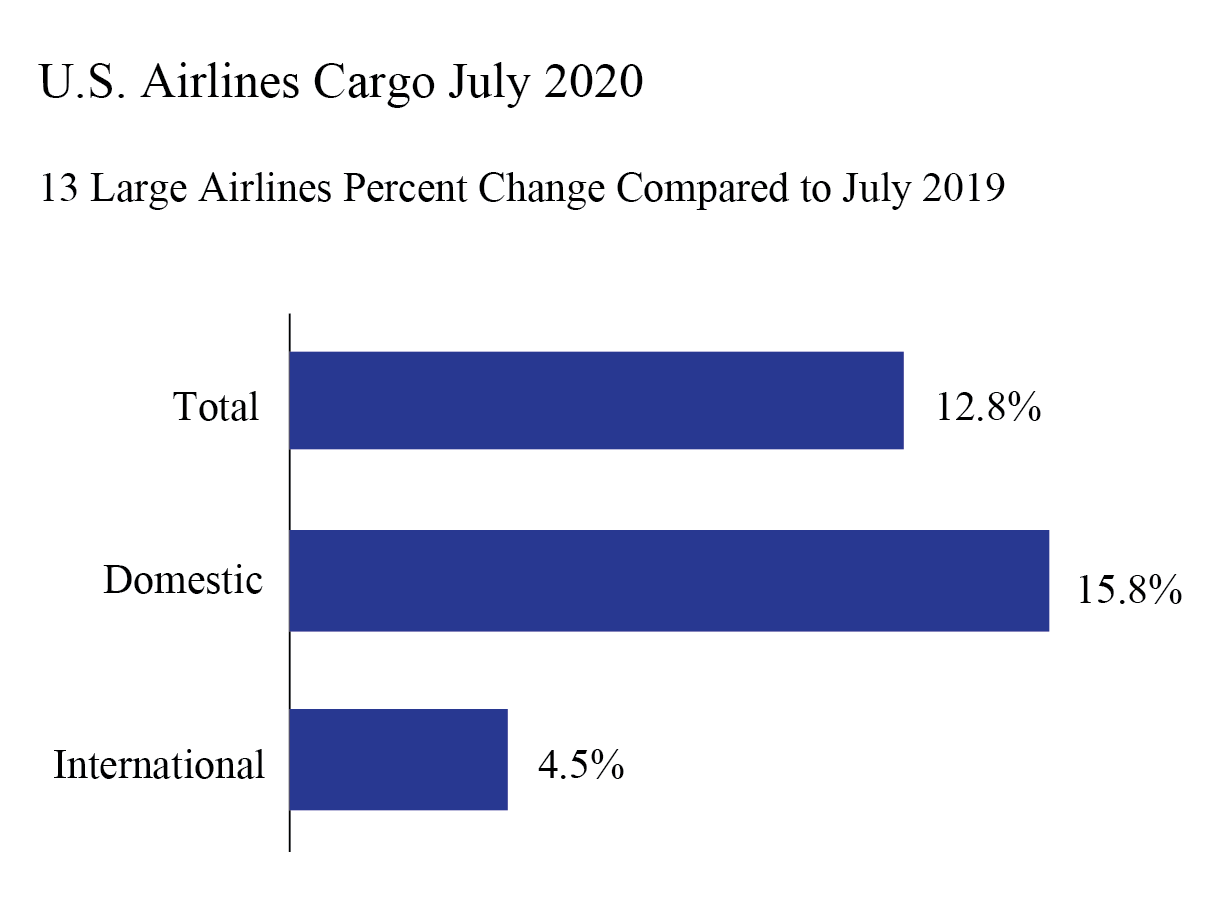
- Total: 1,643 thousand tons, up 12.8% from July 2019 (1,457T tons)
- Domestic: 1,235 thousand tons, up 15.8% from July 2019 (1,066T tons)
- International: 408 thousand tons, up 4.5% from July 2019 (390T tons)
U.S. airline cargo reports are filed monthly with BTS. Final July data will be released on Oct. 16. Complete international data by origin and destination, which is under a six-month confidentiality restriction, will be released on Jan. 14.
Systemwide Cargo (Domestic + International)
July 2020 (preliminary) was the third consecutive month that U.S. airlines carried more total cargo than they did during the same month of the previous year. The 12.8% increase from July 2019 was the largest year-to-year gain since June 2010 (16.3%).
| 2016-2017 | 2017-2018 | 2018-2019 | 2019-2020 | |
|---|---|---|---|---|
January | 6.4 | 10.5 | 5.1 | -0.5 |
February | 6.1 | 9.2 | -0.3 | -0.1 |
March | 8.0 | 5.8 | -0.2 | -1.6 |
April | 2.6 | 5.9 | 4.4 | -1.9 |
May | 10.8 | 9.0 | 3.1 | 0.9 |
June | 6.8 | 5.5 | -1.1 | 9.1 |
July | 6.9 | 6.7 | 3.5 | 12.8* |
August | 9.7 | 5.0 | 0.2 | |
September | 4.3 | 5.0 | -4.4 | |
October | 10.6 | 5.5 | -1.2 | |
November | 10.6 | -0.6 | -2.3 | |
December | 5.6 | 0.3 | 0.7 | |
Jan-July | 6.8 | 7.5 | -1.0 | 2.7 |
| Annual | 7.4 | 5.4 | 0.6 |
Source: Bureau of Transportation Statistics, T-100 Market
* July 2020 data is preliminary
Domestic Cargo
July 2020 was the eighth consecutive month (preliminary) that U.S. airlines carried more domestic cargo than they did during the same month of the previous year. The 15.8% increase from July 2019 was the largest year-to-year gain since May 2009. Domestic cargo comprised 75% of total U.S. airlines cargo in July 2020, compared to 73% in July 2019.
| 2016-2017 | 2017-2018 | 2018-2019 | 2019-2020 | |
|---|---|---|---|---|
January | 4.6 | 10.4 | 6.1 | 2.8 |
February | 4.9 | 8.7 | 0.7 | 2.2 |
March | 7.1 | 4.0 | -0.4 | 3.1 |
April | 1.5 | 4.9 | 7.7 | 3.1 |
May | 10.8 | 8.9 | 4.5 | 4.2 |
June | 5.4 | 4.5 | 0.5 | 12.7 |
July | 5.2 | 6.7 | 6.2 | 15.8* |
August | 9.4 | 4.8 | 0.1 | |
September | 3.3 | 4.3 | -2.9 | |
October | 11.1 | 5.7 | 1.8 | |
November | 11.3 | -0.1 | -1.8 | |
December | 5.1 | 0.1 | 4.5 | |
Jan-July | 5.7 | 6.8 | 0.7 | 6.3 |
| Annual | 6.7 | 5.0 | 2.2 |
Source: Bureau of Transportation Statistics, T-100 Domestic Market
* July 2020 data is preliminary
International Cargo
U.S. airlines international cargo shipments rose 4.5% by weight (preliminary) from June 2019 to June 2020, the first year-to-year increase since March 2019 (0.4%) and the largest annual gain since October 2018 (5.0%). International cargo comprised 25% of total U.S. airlines cargo in July 2020, compared to 27% in July 2019.
| 2016-2017 | 2017-2018 | 2018-2019 | 2019-2020 | |
|---|---|---|---|---|
January | 11.4 | 10.6 | 2.2 | -9.8 |
February | 9.6 | 10.4 | -3.1 | -6.3 |
March | 10.5 | 10.7 | 0.4 | -13.9 |
April | 5.3 | 8.2 | -3.9 | -15.7 |
May | 11.0 | 9.2 | -0.6 | -8.3 |
June | 10.8 | 8.2 | -5.2 | -0.6 |
July | 11.3 | 6.7 | -3.6 | 4.5* |
August | 10.6 | 5.6 | 0.4 | |
September | 7.2 | 7.0 | -8.3 | |
October | 9.4 | 5.0 | -8.7 | |
November | 8.8 | -1.8 | -3.5 | |
December | 7.2 | 0.9 | -10.6 | |
Jan-July | 9.5 | 9.8 | -6.4 | -7.2 |
Annual | 9.4 | 6.5 | -3.8 |
Source: Bureau of Transportation Statistics, T-100 International Market
* July 2020 data is preliminary
Reporting Notes
Data are compiled from monthly reports filed with BTS by commercial U.S. air carriers detailing operations, passenger traffic and freight traffic. This release includes data received by BTS from 15 U.S. airlines as of Sept. 2.
See the BTS Airlines and Airports page for additional U.S. airlines numbers through May for U.S. airlines. International data by origin and destination is available through February.
None of the data are from samples. Measures of statistical significance do not apply to the complete air traffic data.