
BTS Offers COVID-19 Related Daily, Weekly and Monthly Transportation Statistics
Date: Tuesday, August 4, 2020
Responding to heightened interest in the most recent transportation data, the Bureau of Transportation Statistics (BTS) has created new web pages of daily, weekly and monthly statistics. These pages allow comparison of pre-COVID-19 and current numbers for passenger travel and freight shipments.
The new pages present a wide range of data on all transportation modes from various sources, and BTS will add more measures as they become available.
Daily Travel during the COVID-19 Pandemic
What it shows: The percent and number of people staying home and not staying home each day, and the number of trips taken each day for 10 different distance groupings.
How recent: Two-week lag
Update Frequency: Weekly on Monday
Geography level: National, State, County
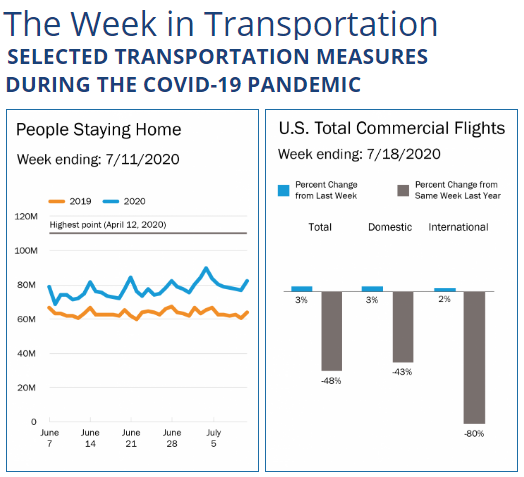
The Week in Transportation: Selected Transportation Measures During COVID-19 Pandemic
What it shows: The percent and number of people staying home and not staying home each day and the number of trips taken each day for four different distance groupings; commercial flights operated and people screened at airports; transit ridership; truck and rail freight activity; and passenger travel into the U.S. from Mexico and Canada.
How recent: Some measures are as recent as one-day old; others have a two-week lag.
Update Frequency: Weekly on Tuesday
Geography level: National
Docked Bikeshare Ridership: COVID-19 Effects
What it shows: Daily use in 2020 compared to 2019 for bikeshare systems with docking stations.
How recent: Through June 2020 for most systems
Update frequency: Updated monthly
Geography level: By bikeshare system, primarily metropolitan area.
Monthly Transportation Statistics
What it shows: More than 60 different measures in the following categories: Economics, Freight Volume & Passenger Travel, On-Time Performance, and Safety
How recent: Lags vary from less than one month to three months.
Update Frequency: Throughout the month
Geography level: National
County Transportation Profiles
What it shows: County-level transportation data including recent person-trips, airports, bridges,
demographics, maritime and rail
How recent: Person-trips from previous week
Update frequency: Person-trips weekly on Monday; others as numbers become available
Geography level: County
In addition to the regularly updated pages, BTS has also released the following web pages:
4th of July Travel: 2020 vs. 2019
April's One-Two Punch: as Scheduled Flights Hit Record Lows, Cancellations Reach New Highs
U.S. airlines operated an all-time monthly low of 194,390 domestic flights in April 2020, compared to the previous low of 370,027 in February 1994.
March Day-by-Day: How Flight Cancellations Rose to 17%
The March 2020 flight cancellation rate —17% of flights were canceled— at the time was the highest since September 2001, when 20% of flights were canceled. The cancellation rate was exceeded in April when 41% of flights were canceled.