
BTS Updates National Transportation Statistics with U.S. Passenger Miles, People Residing in Areas of Significant Noise Exposure, and Other Historical Tables
The Bureau of Transportation Statistics (BTS) today released its monthly update to National Transportation Statistics (NTS), a collection of annual transportation measures at the national level.
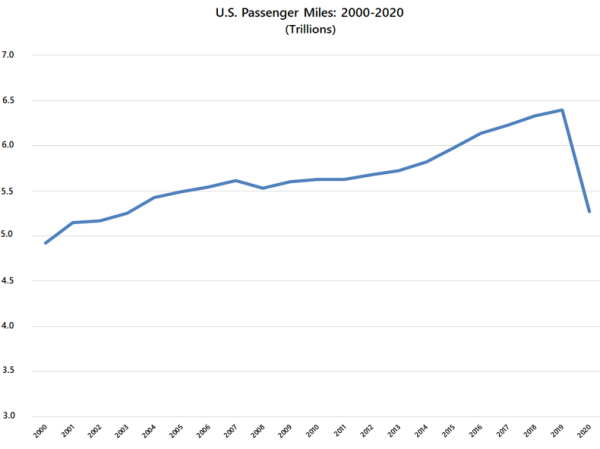
This month’s featured table, U.S. Passenger Miles, looks at how Americans are moving around. The total in the chart below comprises Domestic Air Travel, Roadways, Transit, and Intercity Rail. The January release also features tables on the number of road miles on U.S. streets and highways; transportation safety by mode; spending on transportation by Federal, State, and Local governments; and transportation energy consumption.
This month’s updated annual tables by transportation topic:
Physical Extent
- U.S. Public Road and Street Mileage by Functional System (1-5)
- Estimated U.S. Roadway Lane-Miles by Functional System (1-6, 1-6M)
Travel and Goods Movement
- Roadway Vehicle-Miles Traveled (VMT) and VMT per Lane-Mile by Functional System (1-36, 1-36M)
- U.S. Passenger-Miles (1-40, 1-40M)
- Principal Means of Transportation to Work (1-41)
- Tonnage of Top 50 U.S. Water Ports, Ranked by Total Tons (1-57)
Multimodal Safety
- Distribution of Transportation Fatalities by Mode (2-4)
Government Finance
- Federal, State, and Local Government Transportation-Related Revenues and Expenditures, Fiscal Year (millions of current dollars) (3-29)
- Federal, State, and Local Government Transportation-Related Revenues and Expenditures, Fiscal Year (millions of chained 2012 dollars) (3-30)
- Summary of Transportation Revenues and Expenditures from Own Funds and User Coverage, Fiscal Year (millions of Current and chained 2012 dollars) (3-31)
- Transportation Revenues by Level of Government and Mode, Fiscal Year (millions of current dollars) (3-32)
- Transportation Revenues by Level of Government and Mode, Fiscal Year (millions of chained 2012 dollars) (3-33)
- Transportation Expenditures by Level of Government and Mode from Own Funds, Fiscal Year (millions of current dollars) (3-35)
- Transportation Expenditures by Level of Government and Mode from Own Funds, Fiscal Year (millions of chained 2012 dollars) (3-36)
- Federal Transportation Transfers to State and Local Governments by Mode, Fiscal Year (millions of current dollars) (3-37)
- Federal Transportation Transfers to State and Local Governments by Mode, Fiscal Year (millions of chained 2012 dollars) (3-38)
U.S. Transportation Section Energy Consumption
- Overview of U.S. Petroleum Production, Imports, Exports, and Consumption (4-1)
Transportation Energy Consumption by Mode
- Domestic Demand for Gasoline by Mode (4-7, 4-7M)
Water Pollution, Noise, and Solid Waste
- Leaking Underground Storage Tank Releases and Cleanups (4-55)
- Number of People Residing in Areas of Significant Noise Exposure Around U.S. Airports (4-57)
For monthly national transportation measures, please visit BTS Monthly Transportation Statistics.