
Estimated February 2019 U.S. Airline Traffic Data
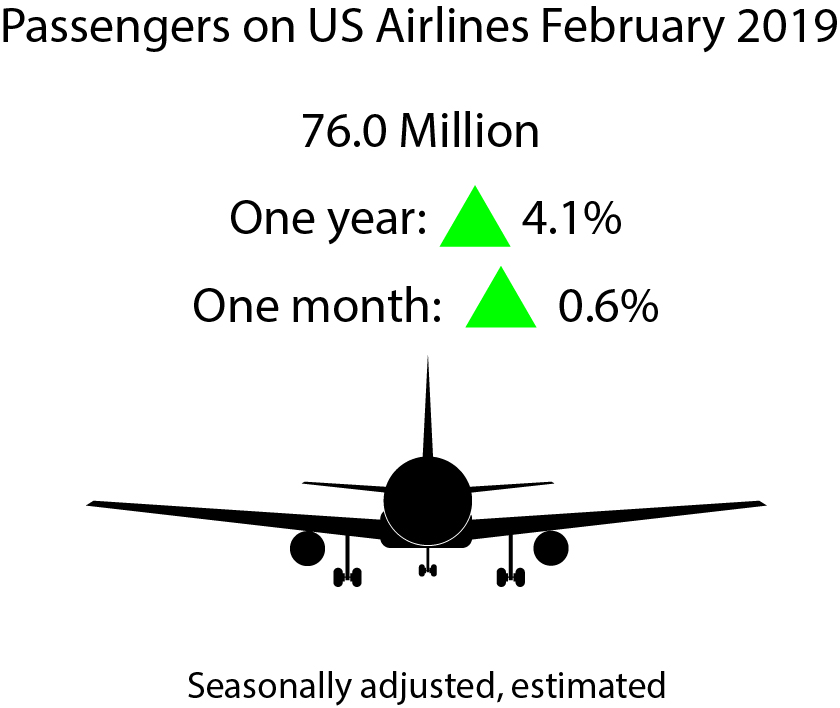
U.S. airlines carried an estimated 76.0 million systemwide (domestic and international) scheduled service passengers, seasonally-adjusted, in February 2019, up 0.6 percent from the January second estimate, according to the Bureau of Transportation Statistics’ (BTS) first February estimate.
The BTS estimate of a February enplanement total of 76.0 million would be a new seasonally-adjusted all-time high monthly total.
This release is a statistical estimate based on U.S. airlines reported data through December. BTS will release a second estimate of U.S. airlines February air traffic on April 11, followed by a release of the reported data on May 16.
Figure 1. Seasonally-Adjusted Systemwide Passenger Enplanements on All U.S. Scheduled Airlines (Domestic & International), Feb 2016 - Feb 2019 (Jan 2019-Feb 2019 estimated)
| Enplanements in millions (Seasonally Adjusted) | 1 | |
|---|---|---|
| Feb-16 | 67.8 | 2 |
| Mar-16 | 67.2 | 3 |
| Apr-16 | 67.9 | 4 |
| May-16 | 68.6 | 5 |
| Jun-16 | 68.8 | 6 |
| Jul-16 | 68.5 | 7 |
| Aug-16 | 67.9 | 8 |
| Sep-16 | 69.4 | 9 |
| Oct-16 | 69.2 | 10 |
| Nov-16 | 69.6 | 11 |
| Dec-16 | 69.6 | 12 |
| Jan-17 | 69.8 | 13 |
| Feb-17 | 69.6 | 14 |
| Mar-17 | 70.1 | 15 |
| Apr-17 | 70.5 | 16 |
| May-17 | 70.9 | 17 |
| Jun-17 | 70.7 | 18 |
| Jul-17 | 72.0 | 19 |
| Aug-17 | 71.1 | 20 |
| Sep-17 | 68.5 | 21 |
| Oct-17 | 72.0 | 22 |
| Nov-17 | 72.3 | 23 |
| Dec-17 | 72.3 | 24 |
| Jan-18 | 71.9 | 25 |
| Feb-18 | 73.0 | 26 |
| Mar-18 | 73.3 | 27 |
| Apr-18 | 74.0 | 28 |
| May-18 | 74.0 | 29 |
| Jun-18 | 75.0 | 30 |
| Jul-18 | 75.8 | 31 |
| Aug-18 | 74.6 | 32 |
| Sep-18 | 72.5 | 33 |
| Oct-18 | 75.0 | 34 |
| Nov-18 | 74.9 | 35 |
| Dec-18 | 75.4 | 36 |
| Jan-19 | 75.6 | 37 |
| Feb-19 | 76.0 | 38 |
Most recent two months estimated
Compared to Previous Month - January 2019 Estimate
Compared to Previous Year - February 2018 Reported
Compared to Three Years Previous - February 2016 Reported:
For the January and February estimates and for data filed through December, see accompanying tables. For the complete database of reported data, see Traffic.
Available seat-miles: Systemwide and domestic available seat miles (ASMs) reached new seasonally-adjusted all-time highs compared to reported data through December.
Load factor is a measure of the use of aircraft capacity that compares the system use, measured in RPMs as a proportion of system capacity, measured ASMs.
The estimated seasonally-adjusted load factor rose from January (83.6) to February (83.7) because estimated passenger travel grew faster (0.40 percent increase in RPMs) than estimated system capacity (0.36 percent increase in ASMs).
Seasonally-adjusted trends are for the time period January 2000 to present based on data reported by U.S. airlines through December and BTS estimates for the two most recent months. Additional data, including domestic and international numbers, can be found on the seasonally-adjusted data page.
Estimated Unadjusted Trends, February 2019
Figure 2. Unadjusted Systemwide Passenger Enplanements on All U.S. Scheduled Airlines (Domestic & International), Feb 2016 - Feb 2019 (Jan 2019-Feb 2019 estimated)
| Enplanements in millions (Unadjusted) | 1 | |
|---|---|---|
| Feb-16 | 58.5 | 2 |
| Mar-16 | 70.6 | 3 |
| Apr-16 | 67.2 | 4 |
| May-16 | 71.5 | 5 |
| Jun-16 | 74.5 | 6 |
| Jul-16 | 76.9 | 7 |
| Aug-16 | 73.5 | 8 |
| Sep-16 | 66.5 | 9 |
| Oct-16 | 69.5 | 10 |
| Nov-16 | 66.6 | 11 |
| Dec-16 | 68.0 | 12 |
| Jan-17 | 62.6 | 13 |
| Feb-17 | 58.4 | 14 |
| Mar-17 | 73.0 | 15 |
| Apr-17 | 70.3 | 16 |
| May-17 | 73.7 | 17 |
| Jun-17 | 77.0 | 18 |
| Jul-17 | 79.8 | 19 |
| Aug-17 | 77.1 | 20 |
| Sep-17 | 64.9 | 21 |
| Oct-17 | 72.7 | 22 |
| Nov-17 | 69.6 | 23 |
| Dec-17 | 70.3 | 24 |
| Jan-18 | 64.4 | 25 |
| Feb-18 | 61.7 | 26 |
| Mar-18 | 76.3 | 27 |
| Apr-18 | 73.6 | 28 |
| May-18 | 77.3 | 29 |
| Jun-18 | 80.9 | 30 |
| Jul-18 | 84.0 | 31 |
| Aug-18 | 81.0 | 32 |
| Sep-18 | 68.7 | 33 |
| Oct-18 | 75.5 | 34 |
| Nov-18 | 72.7 | 35 |
| Dec-18 | 72.9 | 36 |
| Jan-19 | 68.4 | 37 |
| Feb-19 | 64.7 | 38 |
Most recent two months estimated
Estimated February 2019 systemwide passengers (64.7M), domestic passengers (56.7M) and international passengers (7.92M) compared to:
Compared to Previous Month - January 2019 Estimate
Unadjusted revenue passenger-miles: Systemwide, domestic and international revenue passenger miles (RPMs) reached new estimated highs for the month of February compared to reported data for previous years.
Unadjusted available seat-miles: Systemwide, domestic and international available seat miles (ASMs) reached new estimated highs for the month of February compared to reported data for previous years.
Unadjusted load factor declined from the reported February 2018 (80.1) to the estimated February 2019 (80.06) despite estimated growth in passenger travel (4.67 percent increase in RPMs) because estimated system capacity grew slightly faster (4.73 percent increase in ASMs).
Unadjusted trends are for the time period January 1996 to present based on data reported by U.S. airlines through December and BTS estimates for the two most recent months. Data through December are available at Customize Table. Reported data and estimates for the two most recent months can be downloaded from the seasonally-adjusted data page.
U.S. Airlines Reported Data for December
Compared to Previous Month - November 2018
Unadjusted: Systemwide, domestic, and international enplanements all reached all-time highs for the month of December.
Reported December 2018 systemwide passengers (72.9M), domestic passengers (63.6M) and international passengers (9.24M) compared to:
Seasonal adjustment of the data removes the seasonal events that follow a regular seasonal pattern. Changes that are not due to seasonality, such as a change in air travel resulting from economic conditions become more readily apparent.
The aviation data are seasonally adjusted for the effects of trading day, moving holidays, and data outliers.
See Seasonal Adjustment for methodology and additional explanation.
Reporting Notes
Data are compiled from monthly reports filed with BTS by commercial U.S. air carriers detailing operations, passenger traffic and freight traffic. This release includes data received by BTS from 77 U.S. carriers as of March 5 for U.S. carrier scheduled civilian operations.
See the BTS Airlines and Airports page for additional scheduled service numbers through December for U.S. and foreign airlines. International data by origin and destination is available through September.
BTS has scheduled April 11 for the release of the first estimate of March air traffic data, the second estimate of February air traffic data and reported data through January.
None of the data are from samples. Measures of statistical significance do not apply to the complete air traffic data.