
First Quarter 2020 Air Fare Drops to New Low
U.S. domestic average air fares declined in the first quarter of 2020 to $336, the lowest inflation-adjusted quarterly air fare on record in Bureau of Transportation Statistics (BTS) records dating back to 1995. The previous low was $347 in the third quarter of 2019.
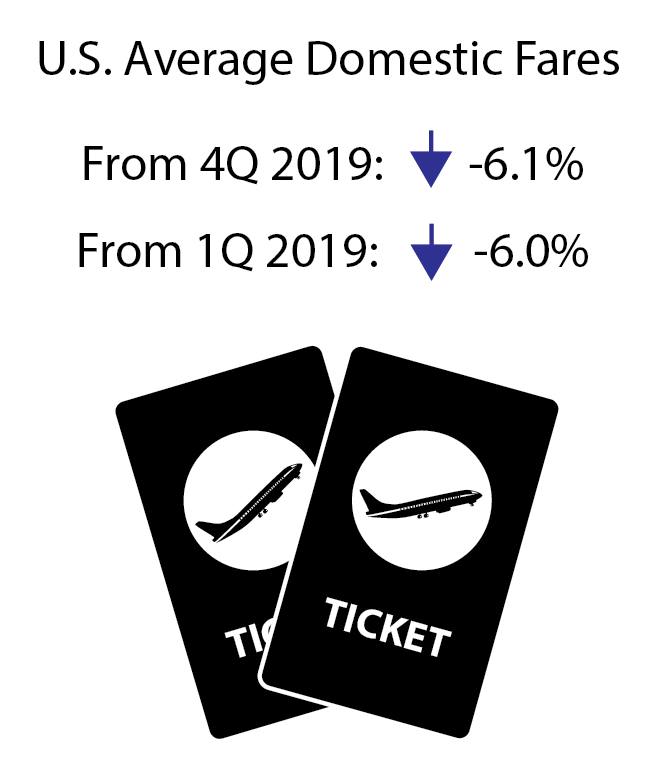
Adjusted for inflation, (constant 2020 dollars) the first-quarter 2020 air fare was:
- Down 6.0% from 1Q 2019 ($358)
- Down 6.1% from 4Q 2019 ($358)
- Down 21.6% from 1Q 2015 ($429)
Percent change based on unrounded numbers. COVID-19 effects on numbers of passengers and flights did not begin until the latter part of the January-March reporting period.
Source: Bureau of Transportation Statistics, BTS Air Fares, Origin and Destination Survey
Figure 1. U.S. Average Domestic Fares, 1st Quarter 1995-2020, 1Q 2020
| Figure 1. U.S. Average Domestic Fares, 1st Quarter 1995-2020 | 1 | ||
|---|---|---|---|
| Unadjusted Fares (current dollars) | Inflation-Adjusted (2020$) | 2 | |
| 1995 | 297 | 508 | 3 |
| 1996 | 284 | 473 | 4 |
| 1997 | 283 | 459 | 5 |
| 1998 | 305 | 486 | 6 |
| 1999 | 332 | 520 | 7 |
| 2000 | 340 | 517 | 8 |
| 2001 | 348 | 511 | 9 |
| 2002 | 320 | 465 | 10 |
| 2003 | 319 | 450 | 11 |
| 2004 | 320 | 444 | 12 |
| 2005 | 301 | 406 | 13 |
| 2006 | 323 | 420 | 14 |
| 2007 | 318 | 403 | 15 |
| 2008 | 333 | 406 | 16 |
| 2009 | 314 | 382 | 17 |
| 2010 | 328 | 390 | 18 |
| 2011 | 356 | 414 | 19 |
| 2012 | 373 | 422 | 20 |
| 2013 | 378 | 422 | 21 |
| 2014 | 387 | 426 | 22 |
| 2015 | 390 | 429 | 23 |
| 2016 | 359 | 391 | 24 |
| 2017 | 349 | 371 | 25 |
| 2018 | 346 | 360 | 26 |
| 2019 | 350 | 358 | 27 |
| 2020 | 336 | 336 | 28 |
| 29 |
Bureau of Transportation Statistics, Origin and Destination Survey
Other Revenue: In recent years, airlines increasingly obtain additional revenue from passenger fees, as well as from other sources. U.S. passenger airlines collected 71.3% of total operating revenue of $26.6 billion from passenger fares during the first three months of 2020, down from 88.5% in 1990.
Fares by Airport
Figure 2. Fares by Airport Group based on Number of Originating Domestic Passengers 1Q 2020
| Originating Domestic Passengers | 1Q Fares (current dollars) | 1 |
|---|---|---|
| 2M+ | $328 | 2 |
| 1.5M-2M | $332 | 3 |
| 1M-1.5M | $332 | 4 |
| 500K-1M | $326 | 5 |
| 100K-500K | $346 | 6 |
| 50K-99K | $365 | 7 |
| Top 100 Airports | $334 | 8 |
| All Airports | $336 | 9 |
| 10 |
Source: Bureau of Transportation Statistics, BTS Air Fares, Origin and Destination Survey
Additional data: see Top 100 Airports or All Airports. Second Quarter 2020 average fare data will be released Oct. 20.
Standard error: Results for average fares are based on the BTS Origin & Destination Survey, a 10% sample of airline tickets used during the quarter. Averages for airports with smaller samples may be less reliable.
Note: Results for average fares (actual and inflation-adjusted) are based on the BTS Origin & Destination Survey, a 10% sample of airline tickets used during the quarter. For Q1 2020 results based on all itinerary fares, the standard error is 0.32 and the median fare is $274.36. The 90% confidence interval ranges from $335.60 to $336.65. For results based on round-trip fares, the standard error is 0.43 and the median fare is $343.62. The 90% confidence interval ranges from $402.67 to $404.07. For results based on one-way fares, the standard error is 0.39 and the median fare is $187.85. The 90% confidence interval ranges from $244.28 to $245.58.