
May 2019 U.S. Passenger Airline Employment Data
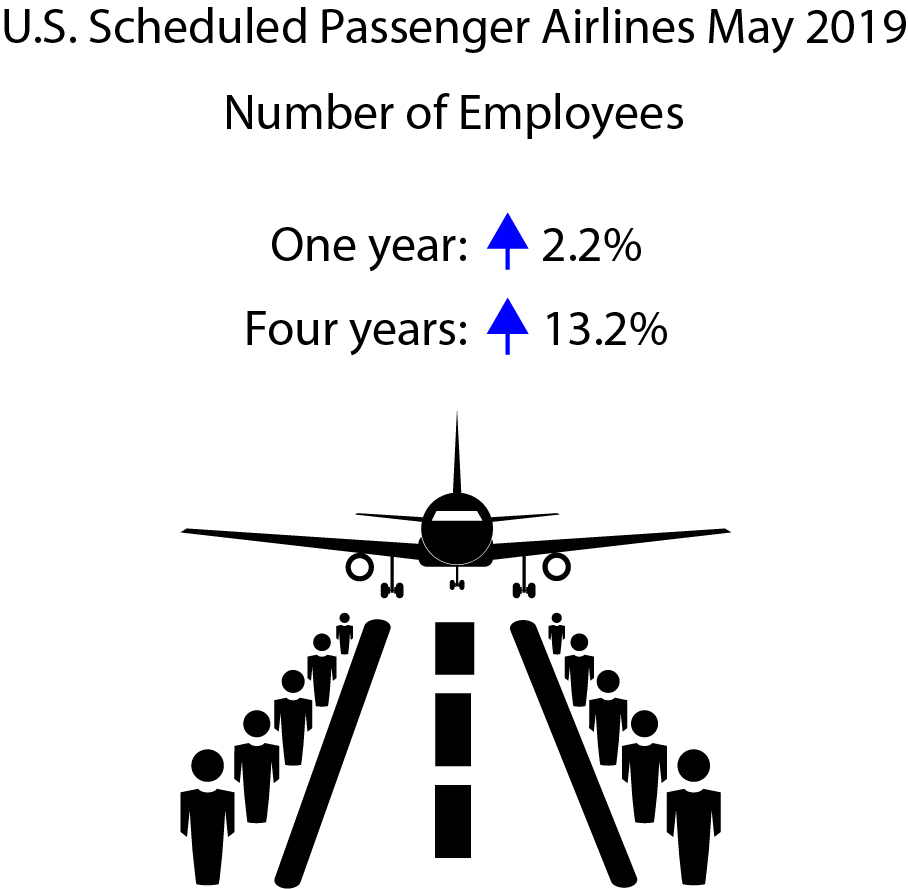
The 21 U.S. scheduled passenger airlines employed 2.2% more workers in May 2019 than in May 2018:
- May’s 447,985 full-time equivalents (FTE) was the highest total for any month since April 2003 (449,288 FTEs).
- May was the 67th consecutive month that U.S. scheduled passenger airline FTEs exceeded the same month of the previous year.
Employees at U.S. Scheduled Passenger Airlines Month of May, 1990-2019
| Year | May FTEs in thousands (000) | 1 |
|---|---|---|
| 1990 | 457.8 | 2 |
| 1991 | 443.6 | 3 |
| 1992 | 450.2 | 4 |
| 1993 | 443.3 | 5 |
| 1994 | 433.2 | 6 |
| 1995 | 425.3 | 7 |
| 1996 | 441.7 | 8 |
| 1997 | 449.9 | 9 |
| 1998 | 468.7 | 10 |
| 1999 | 493.8 | 11 |
| 2000 | 517.5 | 12 |
| 2001 | 542.1 | 13 |
| 2002 | 468.5 | 14 |
| 2003 | 444.4 | 15 |
| 2004 | 438.8 | 16 |
| 2005 | 423.7 | 17 |
| 2006 | 403.7 | 18 |
| 2007 | 411.9 | 19 |
| 2008 | 415.5 | 20 |
| 2009 | 387.4 | 21 |
| 2010 | 377.5 | 22 |
| 2011 | 385.3 | 23 |
| 2012 | 388.5 | 24 |
| 2013 | 381.4 | 25 |
| 2014 | 385.6 | 26 |
| 2015 | 395.6 | 27 |
| 2016 | 410.3 | 28 |
| 2017 | 425.7 | 29 |
| 2018 | 438.2 | 30 |
| 2019 | 448.0 | 31 |
| 32 |
FTE calculations count two part-time employees as one full-time employee.
Bureau of Transportation Statistics
Airline employment reports are filed monthly with the Bureau of Transportation Statistics. See the tables that accompany this release on the BTS website for detailed data since 2015 (Tables 1-15) and industry summary data since 1990.
All 21 scheduled service passenger airlines
- 447,985 FTEs
- Up 2.2% (9,770 FTEs) over May 2018 (438,215 FTEs)
- Up 13.2% (52,364 FTEs) over May 2015 (395,621 FTEs)
Four network airlines
- 288,107 FTEs, 64.3% of total scheduled passenger airline FTEs
- Up 0.8% (2,303 FTEs) over May 2018 (285,804 FTEs)
- Up 9.0% (23,669 FTEs) over May 2015 (264,438 FTEs)
Network airlines operate a significant portion of their flights using at least one hub where connections are made for flights to down-line destinations or spoke cities. Note that beginning with January 2018 data, Virgin America’s numbers are included with Alaska Airlines in the network category.
Five low-cost airlines
- 95,125 FTEs, 21.2% of total scheduled passenger airline FTEs
- Up 4.6% (4,198 FTEs) over May 2018 (90,927 FTEs)
- Up 28.3% (20,958 FTEs) over May 2015 (74,167 FTEs)
Low-cost airlines operate under a low-cost business model, with infrastructure and aircraft operating costs below the overall industry average.
10 regional airlines
- 56,612 FTEs, 12.6% of total scheduled passenger airline FTEs
- Up 5.5% (2,950 FTEs) over May 2018 (53,662 FTEs)
- Up 12.2% (6,143 FTEs) over May 2015 (50,469 FTEs)
Regional carriers typically provide service from small cities, using primarily regional jets to support the network carriers’ hub and spoke systems.
Top Employers by Group
- Network: American 101,684 FTEs
- Low-Cost: Southwest 59,637 FTEs
- Regional: SkyWest 14,927 FTEs
Data are compiled from monthly reports filed with BTS by commercial air carriers as of July 10. Additional airline employment data and previous releases can be found on the BTS website. BTS has scheduled release of June passenger airline employment data for Aug. 16.