
North American Transborder Freight increased 19.4% in April 2026 from April 2025
BTS 26-55
This release is published on a fixed schedule as required by the Office of Management and Budget, and statistics in this release may be revised when inputs to the statistics are corrected or updated. Data on the program page of this website are the most up-to-date and complete.
Source: Bureau of Transportation Statistics TransBorder Freight Data.
The transborder freight data program provides comprehensive monthly and annual data on North American cross-border freight activity, detailing the value of U.S. imports and exports with Canada and Mexico by mode of transportation, commodity, and geography. These data inform infrastructure planning, trade corridor studies, and logistics research. This data release is for April 2026 and is available online on the transborder program homepage.
Total Transborder Freight by Border in April 2026, Compared to April 2025:
Transborder freight between the U.S. and North American countries, Canada and Mexico:
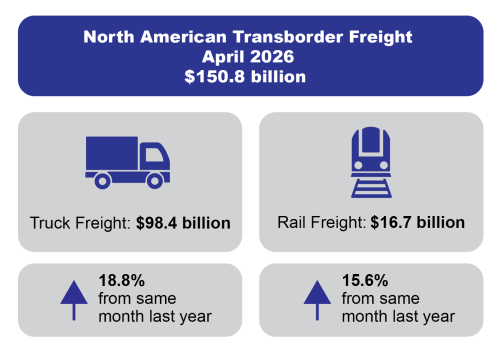
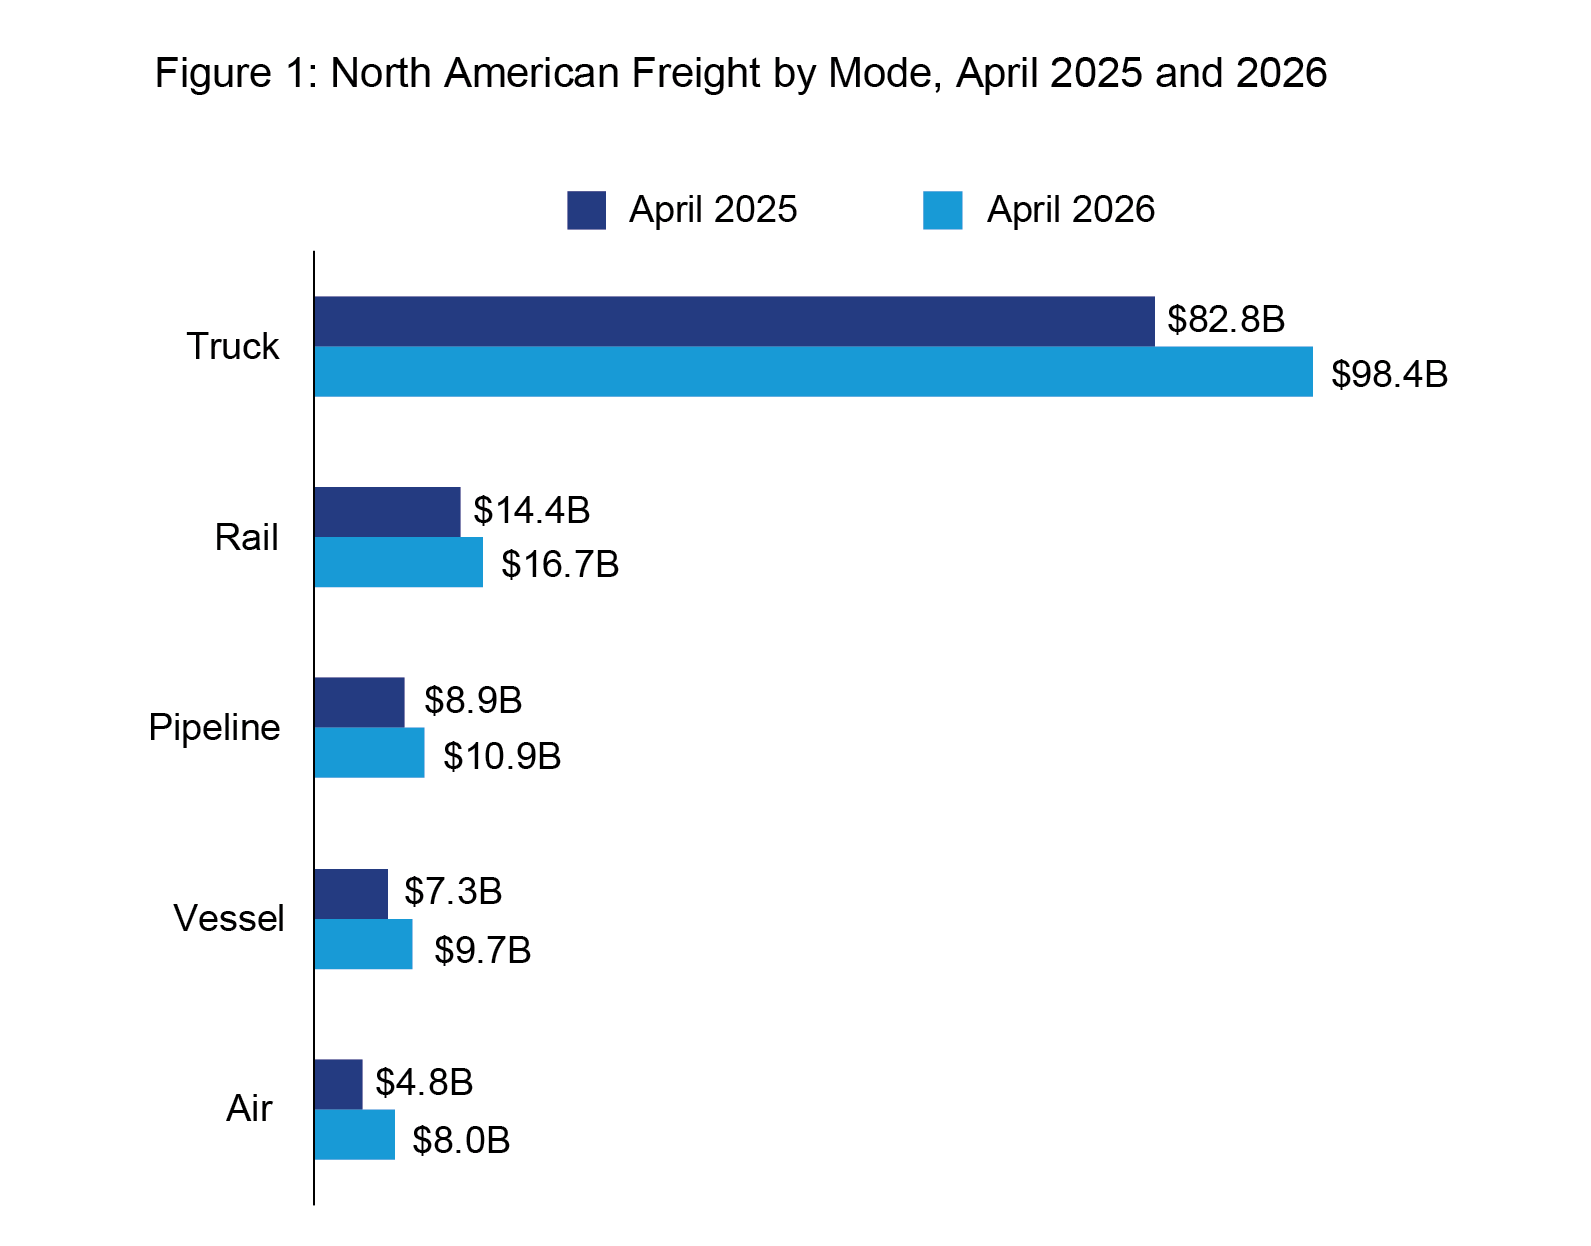
- Total transborder freight: $150.8 billion of transborder freight moved by all modes of transportation, increasing 19.4% compared to April 2025
- Freight between the U.S. and Canada: $64.8 billion, up 14.4% from April 2025
- Freight between the U.S. and Mexico: $86.0 billion, up 23.4% from April 2025
- Trucks moved $98.4 billion of freight, up 18.8% compared to April 2025
- Railways moved $16.7 billion of freight, up 15.6% compared to April 2025
- Vessels moved $9.7 billion of freight, up 33.2% compared to April 2025
- Pipelines moved $10.9 billion of freight, up 22.3% compared to April 2025
- Air moved $8.0 billion of freight, up 66.2% compared to April 2025
Source: Bureau of Transportation Statistics TransBorder Freight Data.
Total Transborder Freight by Border and Mode
U.S.-Canada (both directions) USD, | U.S.-Mexico (both directions) USD, | ||
|---|---|---|---|
| Truck | $ 34.1 | Truck | $ 64.2 |
| Pipeline | $ 10.0 | Rail | $ 8.3 |
| Rail | $ 8.4 | Vessel | $ 5.7 |
| Vessel | $ 3.9 | Air | $ 4.7 |
| Air | $ 3.3 | Pipeline | $ 0.9 |
Detroit, Port Huron, and Buffalo are the top truck ports for U.S. freight flows with Canada, while Laredo, El Paso, and Otay Mesa are the top truck ports with Mexico.
Detroit, Port Huron, and International Falls are the top rail connection ports for U.S. freight flows with Canada, while Laredo, Eagle Pass, and El Paso are the top rail connection ports with Mexico.
Chicago, Port Huron, and Minneapolis are the top pipeline connection regions for U.S. energy freight flows with Canada. El Paso, Hidalgo, and Laredo are the top pipeline connection regions with Mexico.
Port of Boston, Port Arthur, and Portland are the top water port connections for U.S. energy flows with Canada. Port of Houston, Arthur, and Texas City are the top water port connections for U.S. energy flows on the Southern border.
Top 10 Ports and Commodities
Port | USD | Commodity | USD |
|---|---|---|---|
| Laredo - Texas | 33,416,108,604 | Computer-Related Machinery and Parts | 33,366,843,432 |
| Ysleta - Texas | 12,273,970,466 | Vehicles Other than Railway | 20,671,831,354 |
| Detroit - Michigan | 11,764,144,476 | Mineral Fuels; Oils and Waxes | 19,231,708,507 |
| Port Huron - Michigan | 9,994,966,407 | Electrical Machinery; Equipment and Parts | 17,754,128,835 |
| Buffalo - New York | 6,788,881,867 | Plastics and Articles | 5,218,271,858 |
| Otay Mesa - California | 4,981,031,584 | Measuring and Testing Instruments | 4,195,019,547 |
| Santa Teresa - New Mexico | 4,875,700,326 | Pearls; Stones; Metals and Imitation Jewelry | 2,798,062,792 |
| Eagle Pass - Texas | 4,051,451,707 | Aircraft; Spacecraft and Parts | 2,732,113,421 |
| Hidalgo - Texas | 3,796,751,461 | Aluminum and Articles | 1,975,211,886 |
| Pembina - North Dakota | 3,169,186,605 | Furniture; Lamps and Prefabricated Buildings | 1,941,770,978 |
Reporting Notes
All monetary values are in current U.S. dollars and not adjusted for inflation. For previous statistical releases and summary tables, see transborder releases. Visit the transborder freight program homepage for data from previous months and additional state, port, and commodity data.
To receive updates from BTS directly to your email, please consider subscribing to our GovDelivery service.