
Second Quarter 2018 U.S. Airline Financial Data
Results for All 21 Scheduled U.S. Passenger Airlines:
Figure 1. Systemwide U.S. Scheduled Service Passenger Airlines Quarterly Net Income, 2Q 2018
| billions of dollars ($) | 1 | |
|---|---|---|
| 2Q2017 | 4.7 | 2 |
| 3Q2017 | 3.7 | 3 |
| 4Q2017 | 5.1 | 4 |
| 1Q2018 | 1.7 | 5 |
| 2Q2018 | 3.4 | 6 |
| 7 |
Bureau of Transportation Statistics, Schedule P1.2 http://www.transtats.bts.gov/Fields.asp?Table_ID=295
After-tax net income
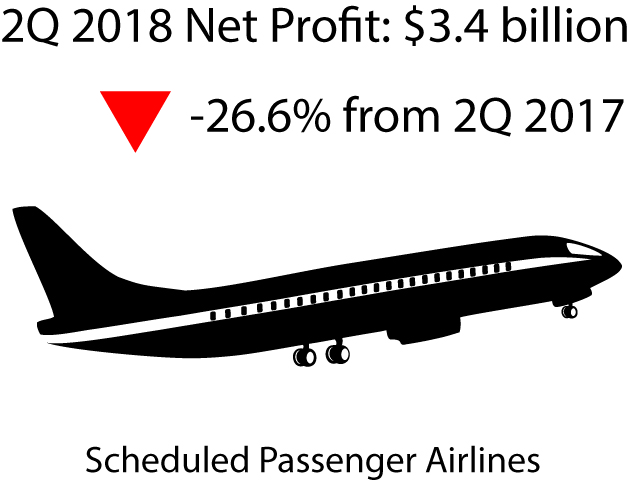
- $3.4 billion in 2Q 2018 (21st consecutive quarterly after-tax net profit)
- Up from $1.7 billion in 1Q 2018
- Down from $4.7 billion in 2Q 2017
Pre-tax operating profit
- $5.5 billion in 2Q 2018 (29th consecutive quarterly pre-tax operating profit)
- Up from $2.6 billion in 1Q 2018
- Down from $7.7 billion in 2Q 2017
- Total operating revenue: $48.9 billion
- $36.3 billion from fares, 74.3 percent of total second-quarter operating revenue
- $1.2 billion in baggage fees, 2.5 percent of total operating revenue
- $694.0 million from reservation change fees, 1.4 percent of total operating revenue
- Total operating expenses: $43.4 billion
- Fuel costs accounted for $8.9 billion, 20.6 percent of total operating expenses
- Labor costs accounted for $14.1 billion, 32.5 percent of total operating expenses
Fees are included for calculations of net income, operating revenue and operating profit or loss.
Domestic operations, includes 21 U.S. airlines:
Figure 2. Domestic U.S. Scheduled Service Passenger Airlines Quarterly Net Income, 2Q 2018
| billions of dollars ($) | 1 | ||||
|---|---|---|---|---|---|
| 2Q2017 | 4.1 | 2 | |||
| 3Q2017 | 2.6 | 3 | |||
| 4Q2017 | 4.8 | 4 | |||
| 1Q2018 | 1.2 | 5 |
Bureau of Transportation Statistics, Schedule P1.2 http://www.transtats.bts.gov/Fields.asp?Table_ID=295
After-tax domestic net income
- $2.5 billion in 2Q 2018 (21st consecutive quarterly domestic after-tax net profit)
- Up from $1.2 billion in 1Q 2018
- Down from $4.1 billion in 2Q 2017
Pre-tax domestic operating profit
- $4.1 billion in 2Q 2018 (29th consecutive quarterly domestic pre-tax operating profit)
- Up from $2.0 billion in 1Q 2018
- Down from $6.5 billion in 2Q 2017
- Total domestic operating revenue: $36.6 billion
- $26.2 billion from fares, 71.5 percent of total second-quarter domestic operating revenue
- $918.7 million in baggage fees, 2.5 percent of total domestic operating revenue
- $472.2 million from reservation change fees, 1.3 percent of total domestic operating revenue
- Total domestic operating expenses: $32.5 billion
- Fuel costs accounted for $6.0 billion, 18.5 percent of total domestic operating expenses
- Labor costs accounted for $10.3 billion, 31.6 percent of total domestic operating expenses
International operations, includes 17 U.S. airlines:
Figure 3. International U.S. Scheduled Service Passenger Airlines Quarterly Net Income, 2Q 2018
| billions of dollars ($) | 1 | ||||
|---|---|---|---|---|---|
| 2Q2017 | 0.6 | 2 | |||
| 3Q2017 | 1.1 | 3 | |||
| 4Q2017 | 0.3 | 4 | |||
| 1Q2018 | 0.4 | 5 |
Bureau of Transportation Statistics, Schedule P1.2 http://www.transtats.bts.gov/Fields.asp?Table_ID=295
After-tax international net income
- $886.6 million in 2Q 2018 (14th consecutive quarterly international after-tax net profit)
- Up from $428.3 million in 1Q 2018
- Up from $613.1 million in 2Q 2017
Pre-tax international operating profit
- $1.4 billion in 2Q 2018 (25th consecutive quarterly international pre-tax operating profit)
- Up from $614.7 million in 1Q 2018
- Up from $1.2 billion in 2Q 2017
- Total international operating revenue: $12.3 billion
- $10.2 billion from fares, 82.7 percent of second-quarter international operating revenue
- $322.0 million in baggage fees, 2.6 percent of international operating revenue
- $221.8 million from reservation change fees, 1.8 percent of international operating revenue
- Total international operating expenses: $11.0 billion,
- Fuel costs accounted for $2.9 billion, 26.6 percent of international operating expenses
- Labor costs accounted for $3.8 billion, 35.1 percent of international operating expenses
Reporting notes
Additional data: BTS website, See tables for operating profit/loss, operating revenue and fuel cost and consumption. See the BTS financial databases for more detailed data including numbers for individual airlines.
Filing requirement: By regulation, for the quarter ending June 30, airlines that operate at least one aircraft that is designed/certified for more than 60 seats or the capacity to carry a payload of passengers and cargo weighing more than 18,000 pounds must report financial data to BTS by Aug. 10. The airline filings are subject to a process of quality assurance and data validations before release to the public.
Data updates: Revised carrier data and late data filings will be made available monthly on TranStats on the Monday following the second Tuesday of the month. All data are subject to revision. BTS will release 3rd-quarter 2018 data on Dec. 10.