


U.S. Cargo and Passenger Airlines Lost 2,783 Jobs in July 2026
BTS 26-69
This release is published on a fixed schedule as required by the Office of Management and Budget, and statistics in this release may be revised when inputs to the statistics are corrected or updated. Data on the program page of this website are the most up-to-date and complete.
Note: Alaska Airlines and Hawaiian Airlines have merged and employment from both companies is now reported solely under Alaska Airlines. Hawaiian Airlines no longer reports separate employment numbers.
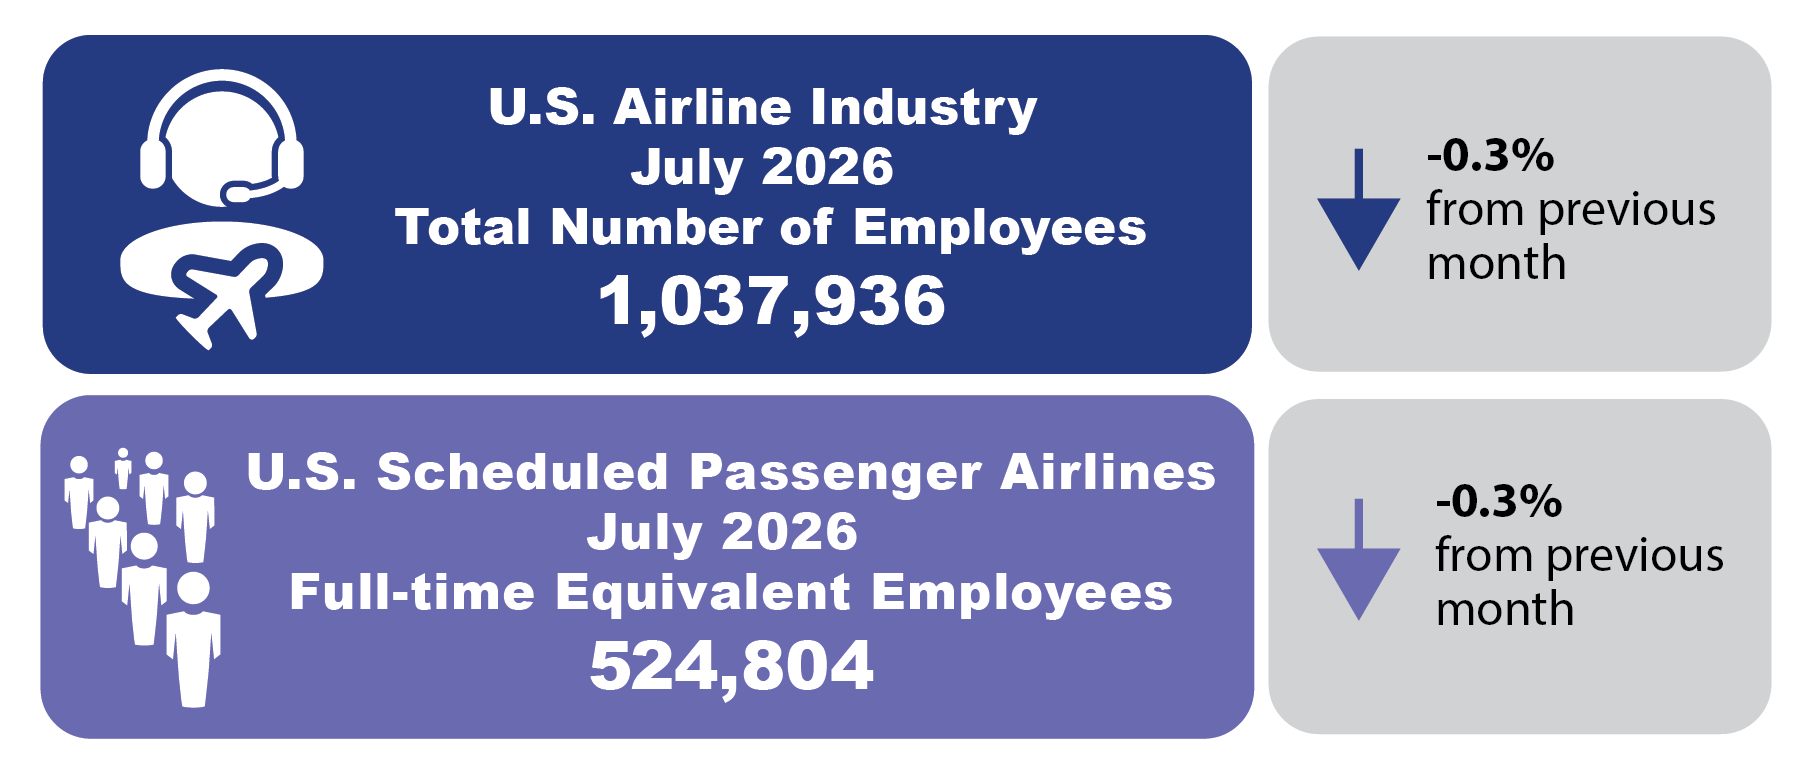
U.S. Airlines: Total Number of Employees (both Full-Time and Part-Time)
U.S. airline industry (passenger and cargo airlines combined) employment decreased to 1,037,936 workers in July 2026, 2,783 (0.27%) fewer workers than in June 2026 (1,040,719).
U.S. scheduled-service passenger airlines employed 555,559 workers in July 2026, or 54% of the industry-wide total. Passenger airlines lost 1,505 employees in July 2026. Breeze Aviation Group led scheduled passenger carriers, adding 86 employees; SkyWest Airlines Inc. added 54, and Republic Airlines added 51.
U.S. cargo airlines employed 477,939 workers in July 2026, or 46% of the industry-wide total. Cargo carriers lost 1,293 employees in July. FedEx, the leading air cargo employer, decreased employment by 1,448 jobs.
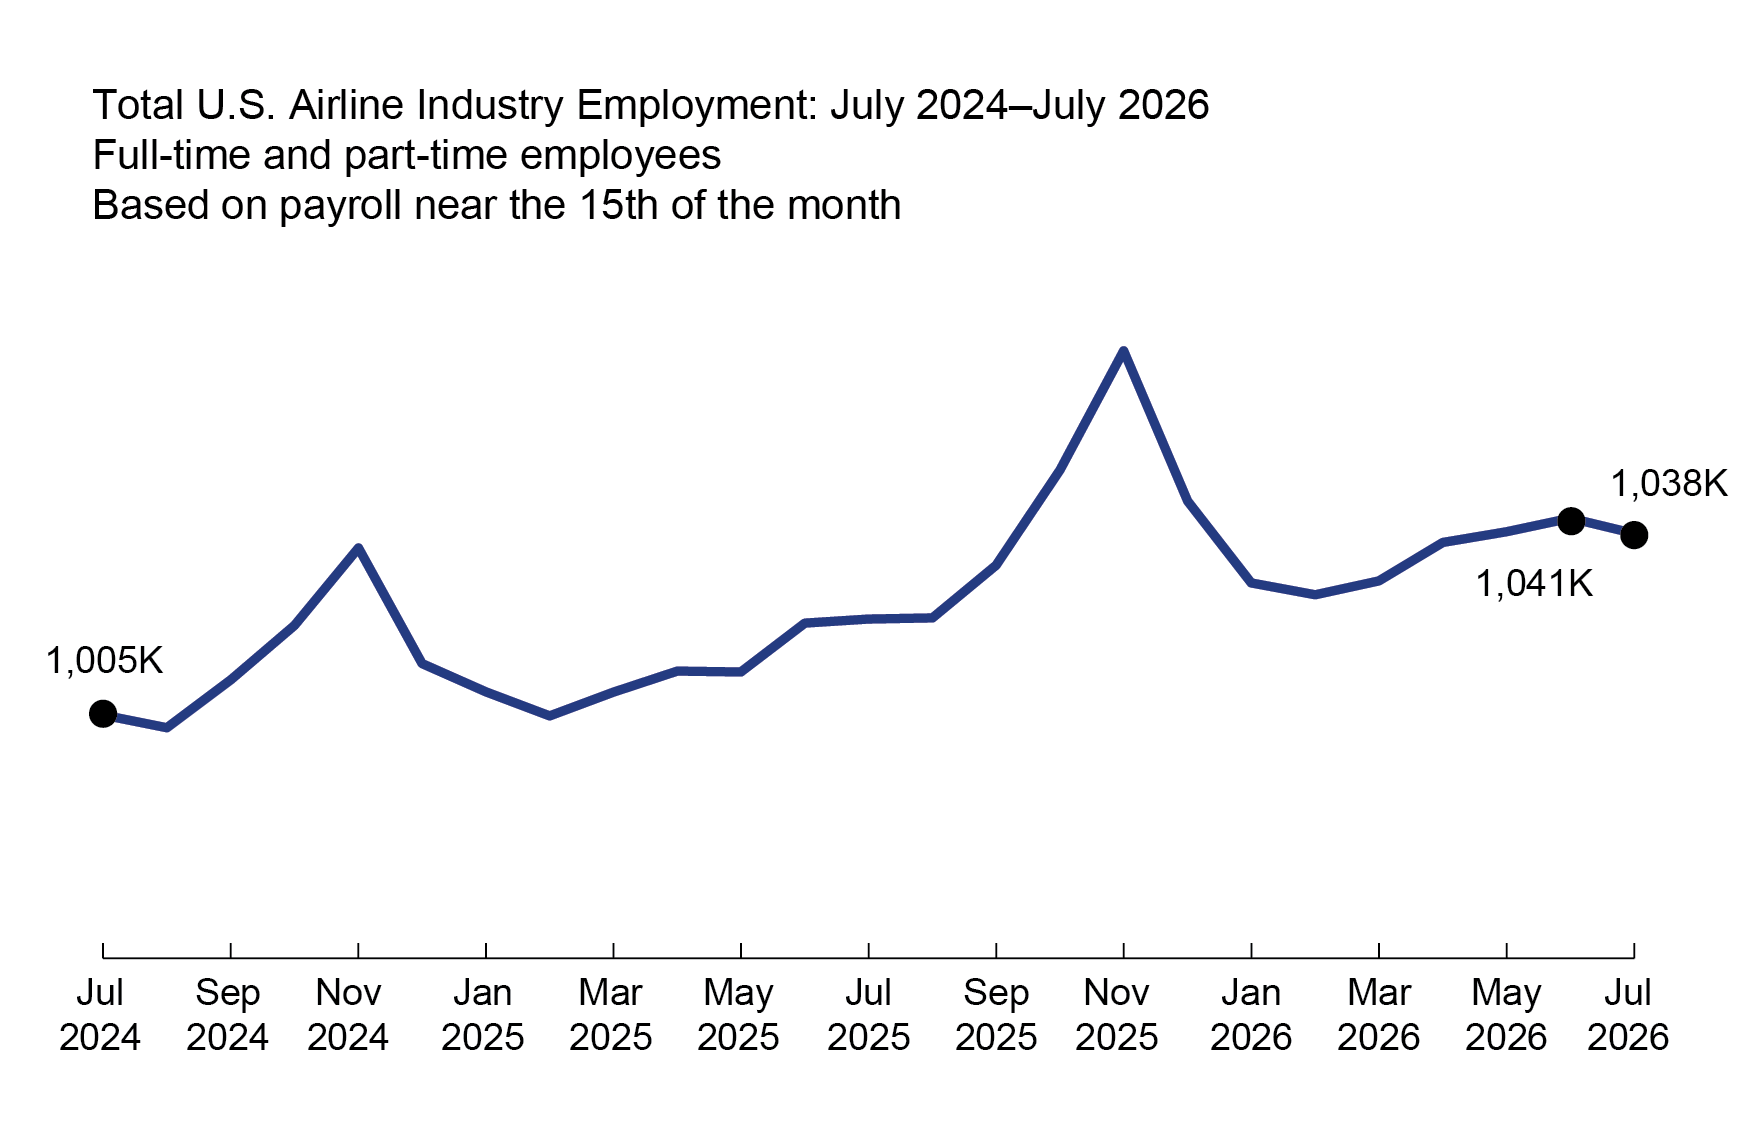
Scheduled passenger airlines lost 1,325 full-time equivalents in July 2026
U.S. Airline Full-Time Equivalents (FTEs)
BTS calculates FTEs by dividing the number of part-time employees by 2 and adding that figure to the number of full-time employees. The July 2026 industry-wide numbers include 748,045 full-time and 289,891 part-time workers for a total of 892,991 FTEs, a decrease from June of 2,289 FTEs (0.26%).
The 24 U.S. scheduled passenger airlines reporting data for July 2026 employed 524,804 FTEs, 1,325 FTEs (0.25%) less than in June 2026. Data by passenger carrier category can be found in the accompanying tables.
U.S. cargo airlines employed 363,837 FTEs in July 2026, down 971 FTEs (0.27%) from June 2026.
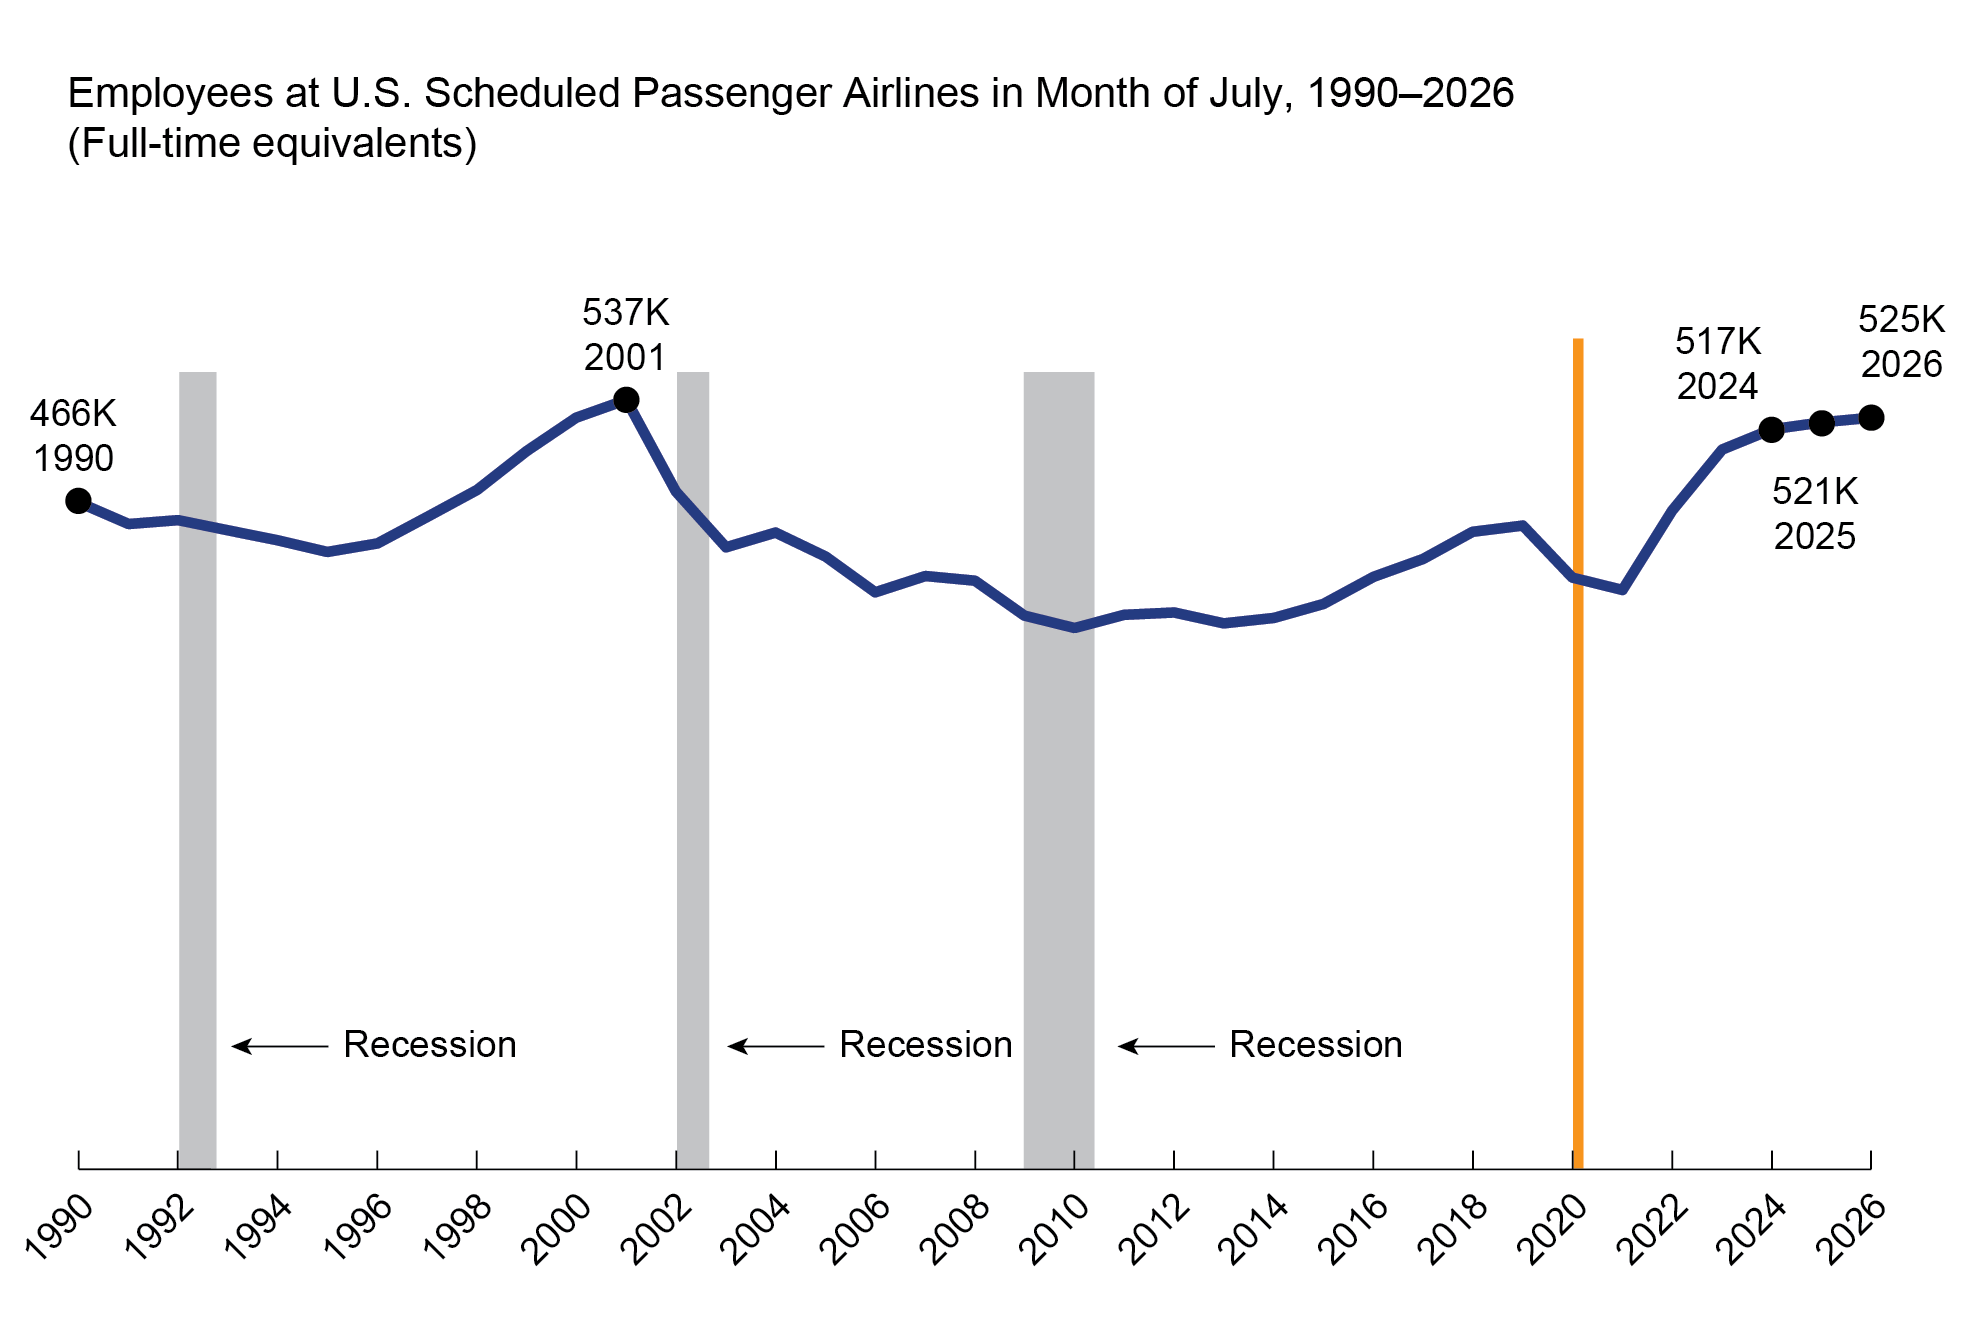
Reporting Notes
Data is compiled from monthly reports filed with BTS by commercial air carriers as of September 4, 2026. Additional airline employment data and previous releases can be found on the BTS website. The month-to-month numbers are not seasonally adjusted.
Passenger, cargo, and charter airlines that operate at least one aircraft that has more than 60 seats or the capacity to carry a payload of passengers, cargo, and fuel weighing more than 18,000 pounds must report monthly employment statistics. Regulations require U.S. airlines to report employment numbers for employees who worked or received pay for any part of the pay period(s) ending nearest the 15th day of the month.
See the tables that accompany this release on the BTS website for detailed data (Tables 1-15) and industry summary monthly data since 1990. Additional individual airline numbers are available on the BTS airline employment web page. The web page provides full-time and part-time employment numbers by carrier by month from 1990 through May 2026.
Missing Carriers: Ameristar Air Cargo (AMQ)
The next update for U.S. airline employment is scheduled for Thursday, October 15, 2026.
To receive updates from BTS directly to your email, please consider subscribing to our GovDelivery service.