
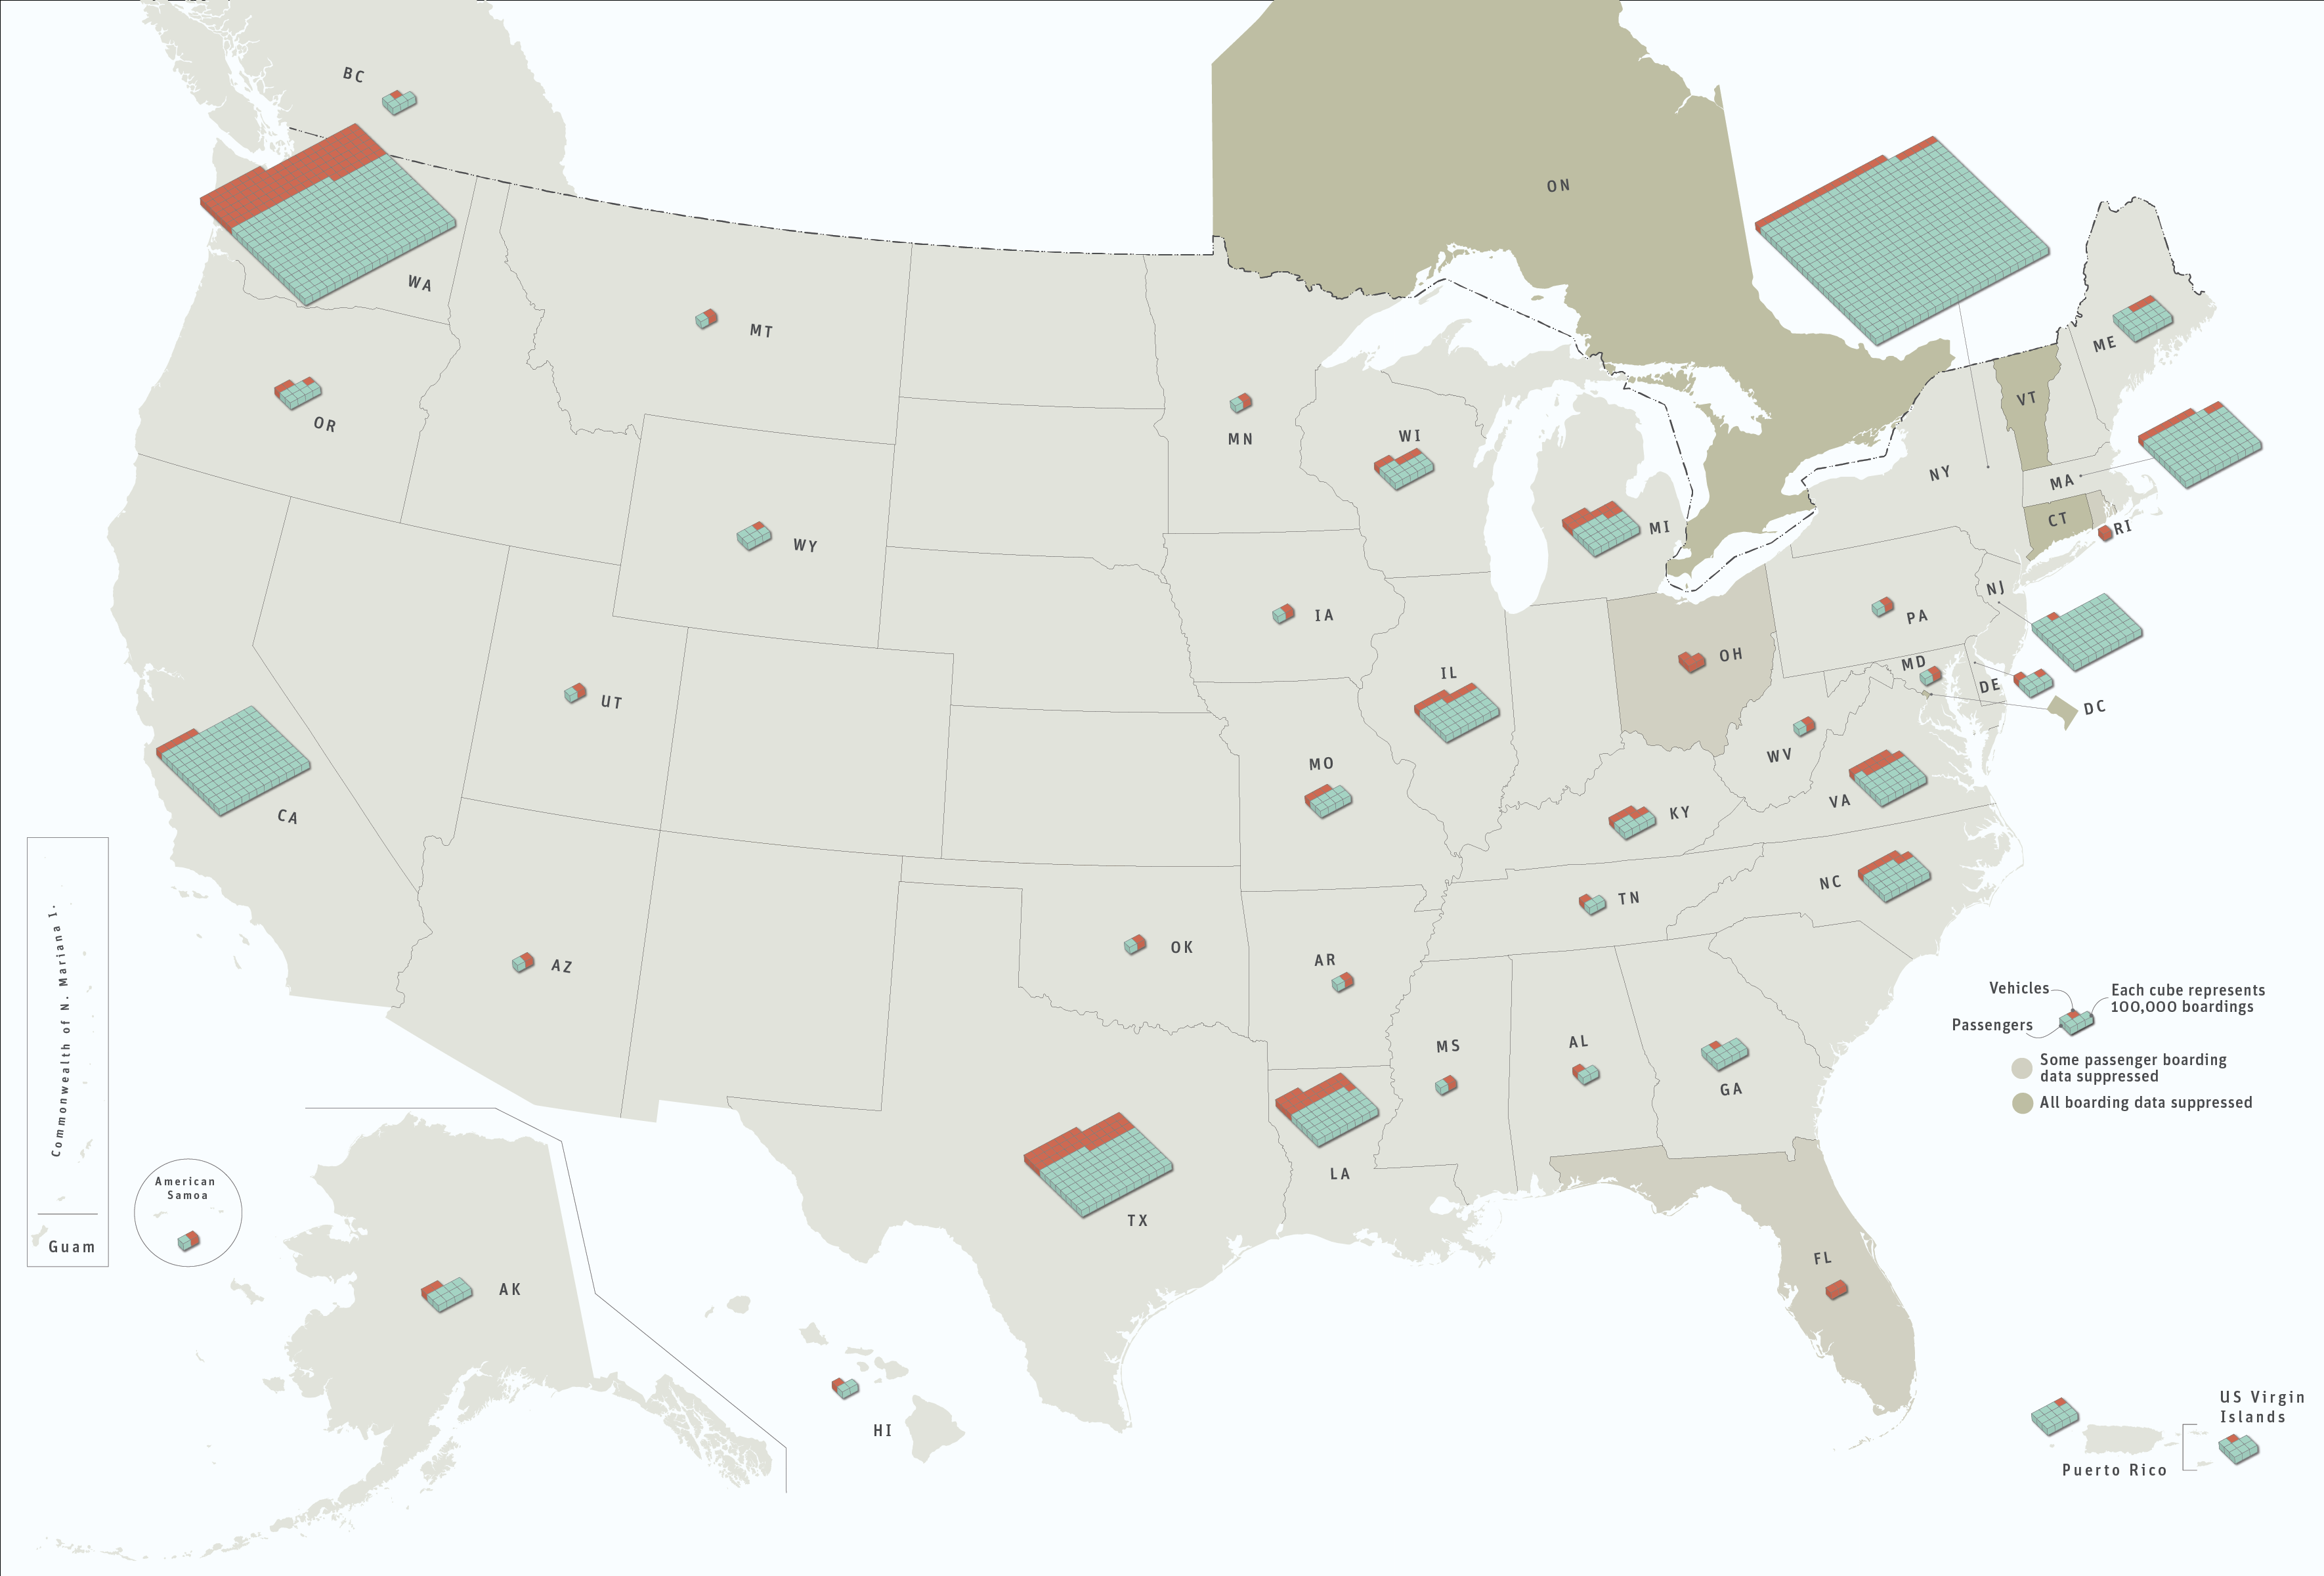
Passenger and Vehicle Ferry Boarding Counts (2017)
Figure
Dataset Table:
| State | Passenger Boarding Counts | Vehicle Boarding Counts | 1 |
|---|---|---|---|
| AK | 809,213 | 235,888 | 2 |
| AL | 240,500 | 81,500 | 3 |
| AR | 50,348 | 15,416 | 4 |
| AZ | 114,858 | 0 | 5 |
| CA | 13,190,680 | 505,158 | 6 |
| CT | * | * | 7 |
| DC | * | * | 8 |
| DE | 489,691 | 212,702 | 9 |
| FL | * | 237,492 | 10 |
| GA | 886,107 | 0 | 11 |
| HI | 163,029 | 0 | 12 |
| IA | 32,062 | 4,160 | 13 |
| IL | 3,105,081 | 831,309 | 14 |
| KY | 648,112 | 466,091 | 15 |
| LA | 3,949,472 | 2,021,741 | 16 |
| MA | 7,784,885 | 876,154 | 17 |
| MD | 80,115 | 81,810 | 18 |
| ME | 1,749,275 | 314,274 | 19 |
| MI | 2,191,313 | 1,082,962 | 20 |
| MN | 0 | 60 | 21 |
| MO | 849,532 | 288,355 | 22 |
| MS | 112,000 | 700 | 23 |
| MT | 3,200 | 1,960 | 24 |
| NC | 2,210,806 | 703,247 | 25 |
| NJ | 6,494,024 | 141,233 | 26 |
| NY | 50,090,870 | 2,164,453 | 27 |
| OH | * | 274,278 | 28 |
| OK | 4,526 | 0 | 29 |
| OR | 712,308 | 330,015 | 30 |
| PA | 146,838 | 0 | 31 |
| RI | * | 72,283 | 32 |
| SC | 428,778 | 0 | 33 |
| TN | 170,674 | 68,270 | 34 |
| TX | 9,036,500 | 3,710,900 | 35 |
| UT | 8,859 | 4,617 | 36 |
| VA | 2,499,787 | 956,720 | 37 |
| VT | * | * | 38 |
| WA | 27,256,204 | 11,488,050 | 39 |
| WI | 1,156,078 | 463,900 | 40 |
| WV | 51,073 | 672 | 41 |
| WY | 523,656 | 0 | 42 |
| U.S. Total* | 137,240,454 | 27,636,370 | 43 |
| AS | 1,608 | 47 | 44 |
| PR | 1,053,288 | 75,418 | 45 |
| VI | 659,213 | 81,966 | 46 |
| U.S. Territories Total | 1,714,109 | 157,431 | 47 |
| BC | 368,887 | 89,903 | 48 |
| ON | * | * | 49 |
| Non-U.S. Total* | 368,887 | 89,903 | 50 |
| Grand Total^ | 144,657,248 | 29,040,984 | 51 |
Dataset Excel:
Ferry Passenger and Vehicle Boarding Counts (2017) REVISED 12Feburary2021.xlsx (12.55 KB)Notes:
Segment boarding counts are assigned to the state of origin
British Columbia (BC) and Ontario (ON), Canada are included on the map as there is reported ferry traffic destined to a U.S. terminal from these Canadian provinces.
State data are subtotals are suppressed when one, two, or all operators in a State or subcategory do not want their reported data released to the public and is denoted by (*)
States with no data had no responding ferry operations.
The Grand Total includes all reported boardings, including values suppressed at the state level (^)
Publications: