Passenger Airline Employment Rose 0.7% in May from April
BTS 47-21
Contact: BTSNews@dot.gov
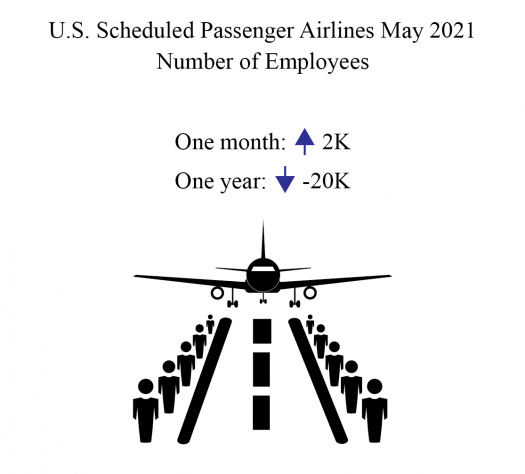
The 24 U.S. scheduled passenger airlines employed 0.7% more full-time equivalents (FTEs) in May 2021 than in April 2021:

An official website of the United States government
Official websites use .gov
A .gov website belongs to an official government organization in the United States.
Secure .gov websites use HTTPS
A lock ( ) or https:// means you’ve safely connected to the .gov website. Share sensitive information only on official, secure websites.
BTS 47-21
Contact: BTSNews@dot.gov
The 24 U.S. scheduled passenger airlines employed 0.7% more full-time equivalents (FTEs) in May 2021 than in April 2021:
Data spotlights represent data and statistics from a specific period of time, and do not reflect ongoing data collection. As individual spotlights are static stories, they are not subject to the Bureau of Transportation Statistics (BTS) web standards and may not be updated after their...
BTS 45-21
Contact: BTSNews@dot.gov
The average U.S. domestic air fare declined in the first quarter of 2021 to $260, down 1.2% from the inflation-adjusted fare of $264 in the fourth quarter of 2020. The first quarter fare of $260 was up 5.0% from the lowest inflation adjusted fare of $248 in the third quarter of 2020.
Adjusted for inflation (constant 2021 dollars) the average 1Q 2021 air fare was:
BTS 43-21
Contact: BTSNews@dot.gov
Data spotlights represent data and statistics from a specific period of time, and do not reflect ongoing data collection. As individual spotlights are static stories, they are not subject to the Bureau of Transportation Statistics (BTS) web standards and may not be updated after their publication date. Please contact BTS to request updated information.