1st-Quarter 2018 Air Fare Data
Date: Tuesday, July 17, 2018
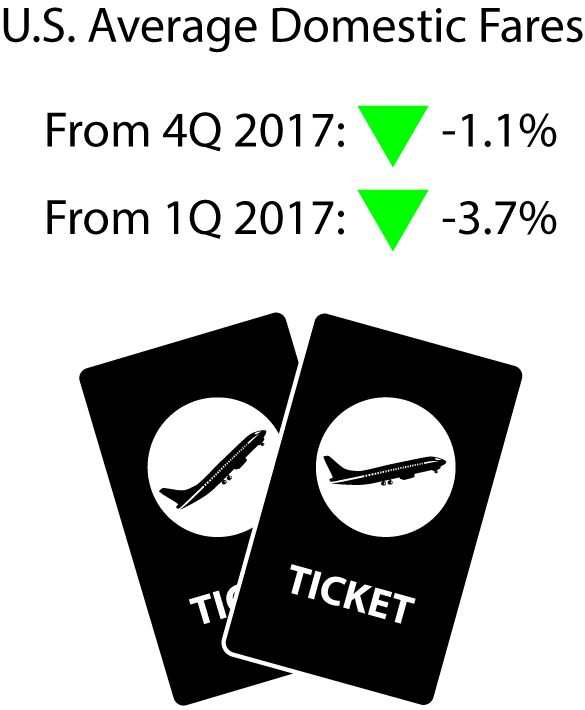
First quarter 2018 average domestic itinerary air fare: $346
- Down 3.7 percent from 1Q 2017 ($360)
- Down 1.1 percent from 4Q 2017 ($350)
Averages adjusted for inflation.

Source: Bureau of Transportation Statistics, BTS Air Fares, Origin and Destination Survey
Inflation-Adjusted Air Fares (Constant 2018 dollars)
Other Revenue: In recent years, airlines obtained additional revenue from passenger fees, as well as from other sources. U.S. passenger airlines collected 73.3 percent of total revenue from passenger fares during 1Q 2018, down from 87.6 percent in 1995.
Fares by Airport
Additional data: see Top 100 Airports or All Airports. Fares for Alaska, Hawaii and Puerto Rico airports are not included in rankings but are available on the web page. Second Quarter 2018 average fare data will be released Oct. 16.
Standard error: Results for average fares are based on the BTS Origin & Destination Survey, a 10 percent sample of airline tickets used during the quarter. Averages for airports with smaller samples may be less reliable.
