

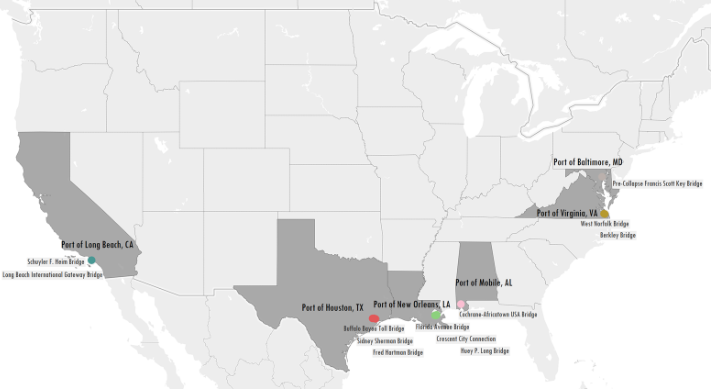
Navigation Channel Bridges at Top-Ranking Ports

An official website of the United States government
Official websites use .gov
A .gov website belongs to an official government organization in the United States.
Secure .gov websites use HTTPS
A lock ( ) or https:// means you’ve safely connected to the .gov website. Share sensitive information only on official, secure websites.
A compilation of some of BTS' most popular air carrier statistics. You can find information on airline passenger counts and cargo between individual airports; airline ticket prices; on-time performance by carrier and flight; as well as airline finance, employment, and fuel costs.
The TSAR presents an overview of the U.S. transportation system and key indicators, including passenger travel, freight, transportation and the economy, reliability, safety, energy and the environment. The report also focuses on closing data gaps and improving how transportation statistics are collected, compiled, analyzed, and published.
The Port Performance Freight Statistics Program: 2025 Annual Report to Congress provides summary statistics and detailed analysis for the Nation’s largest container, tonnage, and dry bulk ports.