USA Banner

Official US Government Icon

Official websites use .gov
A .gov website belongs to an official government organization in the United States.

Secure Site Icon

Secure .gov websites use HTTPS
A lock ( ) or https:// means you’ve safely connected to the .gov website. Share sensitive information only on official, secure websites.

U.S. Department of Transportation U.S. Department of Transportation Icon United States Department of Transportation United States Department of Transportation

September 2016 North American Freight Numbers

Tuesday, November 29, 2016

September 2016 North American Freight Numbers

Month 2014 2015 2016 Percent Change 2014-2015 Percent Change 2015-2016
January 90,326 89,258 82,430 -1.2 -7.7
February 89,557 85,723 84,038 -4.3 -2.0
March 101,478 96,070 90,462 -5.3 -5.8
April 100,141 93,327 90,380 -6.8 -3.2
May 103,942 92,707 89,840 -10.8 -3.1
June 102,978 99,030 92,671 -3.8 -6.4
July 101,075 92,995 83,725 -8.0 -10.0
August 100,624 92,442 93,126 -8.1 0.7
September 102,245 93,246 91,126 -8.8 -2.3
October 108,243 96,624 -10.7
November 96,252 88,154 -8.4
December 95,811 86,748 -9.5
Year-to-date 892,366 834,799 797,798 -6.5 -4.4
Annual 1,192,671 1,106,325 -7.2
Notes:

Note: Values in millions of dollars. Numbers might not add to totals due to rounding.  Percent change based on numbers prior to rounding.

Source:

Source: Bureau of Transportation Statistics, TransBorder Freight Data,

Two transportation modes – rail and air – carried more U.S. freight by value with North American Free Trade Agreement (NAFTA) partners Canada and Mexico in September 2016 compared to September 2015 as total freight on all modes decreased 2.3 percent to $91.1 billion in current dollars, according to the TransBorder Freight Data released today by the U.S. Department of Transportation’s Bureau of Transportation Statistics (BTS).

The total value of cross-border freight has declined from the same month of the previous year in 20 of the past 21 months beginning in January 2015 with only an increase of 0.7 percent in August 2016.

Percent Change in Value of U.S.-NAFTA Freight Flows by Mode: September 2015-2016

Mode September 2015 September 2016 Percent Change September 2015-2016
All Modes Imports 50,497 48,755 -3.4
Exports 42,750 42,371 -0.9
Total 93,246 91,126 -2.3
All Surface Modes Imports 44,473 43,160 -3.0
Exports 34,965 34,785 -0.5
Total 79,438 77,946 -1.9
Truck Imports 31,705 30,100 -5.1
Exports 29,580 28,865 -2.4
Total 61,285 58,965 -3.8
Rail Imports 8,857 9,545 7.8
Exports 4,570 4,953 8.4
Total 13,427 14,498 8.0
Pipeline Imports 3,912 3,515 -10.1
Exports 815 967 18.7
Total 4,726 4,482 -5.2
Vessel Imports 2,678 2,414 -9.8
Exports 2,581 2,487 -3.6
Total 5,258 4,901 -6.8
Air Imports 1,604 1,646 2.7
Exports 2,047 2,127 3.9
Total 3,651 3,773 3.4
Notes:

Notes: Values in millions of current dollars. Numbers might not add to totals due to rounding.   Percent changes based on numbers prior to rounding.  The value of trade for all modes is not equal to the sum of truck, rail, pipeline, vessel and air modes, it also includes shipments made by mail, foreign trade zones, and other transportation.  For additional detail, please refer to the TransBorder web page.

Source:

Source: Bureau of Transportation Statistics, TransBorder Freight Data

The value of commodities moving by rail and air increased 8.0 percent and 3.4 percent respectively, while the value of freight carried on other modes decreased: truck, 3.8 percent; pipeline, 5.2 percent and vessel, 6.8 percent.

Trucks carried 64.7 percent of U.S.-NAFTA freight and continued to be the most heavily utilized mode for moving goods to and from both U.S.-NAFTA partners. Trucks accounted for $30.1 billion of the $48.8 billion of imports (61.7 percent) and $28.9 billion of the $42.4 billion of exports (68.1 percent).

Rail remained the second largest mode by value, moving 15.9 percent of all U.S.-NAFTA freight, followed by vessel, 5.4 percent; pipeline, 4.9 percent; and air, 4.1 percent. The surface transportation modes of truck, rail and pipeline carried 85.5 percent of the total value of U.S.-NAFTA freight flows.

U.S.-Canada Freight

From September 2015 to September 2016, the value of U.S.-Canada freight flows fell 4.4 percent to $46.2 billion mainly due to decreases in the value of goods moved by vessel and pipeline. All modes of transportation except rail carried a lower value of U.S.-Canada freight than a year earlier (Figure 3, Table 3).

Trucks carried 59.6 percent of the value of the freight to and from Canada. Rail carried 16.4 percent followed by pipeline, 9.0 percent; air, 5.1 percent; and vessel, 2.9 percent. The surface transportation modes of truck, rail and pipeline carried 85.0 percent of the value of total U.S.-Canada freight flows (Table 3).

U.S.-Mexico Freight

From September 2015 to September 2016, the value of U.S.-Mexico freight decreased 0.04 percent to $44.9 billion despite four modes of transportation – pipeline, rail, air, and vessel – carrying a higher value of U.S.-Mexico freight than a year earlier. Truck, which accounts for 69.9 percent of the value of freight to and from Mexico, was down 4.0 percent. Freight carried by pipeline increased by 15.3 percent, rail by 12.9 percent, air by 10.9 percent, and vessel by 7.1 percent.

Rail carried 15.4 percent of the value of freight to and from Mexico followed by vessel, 7.9 percent; air, 3.1 percent; and pipeline, 0.8 percent. The surface transportation modes of truck, rail and pipeline carried 86.1 percent of the value of total U.S.-Mexico freight flows.

Commodities

In September 2016, the top commodity category transported between the U.S. and Canada by all modes was vehicles and parts, of which $5.2 billion, or 55.9 percent, moved by truck and $3.9 billion, or 41.8 percent, moved by rail. The top commodity category transported between the U.S. and Mexico by all modes in September 2016 was electrical machinery, of which $7.4 billion, or 81.8 percent, moved by truck.

Reporting Notes

BTS press releases and the BTS website define surface transportation modes as truck, rail and pipeline. See North American TransBorder Freight Data on the BTS website for additional data for surface modes since 1995 and all modes since 2004. The category of all modes of transportation cited in the following tables includes freight movements by truck, rail, vessel, pipeline, air, other and unknown modes of transport. 

Data in this press release are not seasonally adjusted and are not adjusted for inflation. Additional summary data adjusted for inflation and exchange rates can be found on the BTS website under TransBorder Indexed Freight Flow Data. The BLS indexes used in the adjustments for inflation and exchange rates might be revised in each of the three months after original publication. For previous press releases and summary tables, see TransBorder Press Releases.  See TransBorder Freight Data for data from previous months, and for additional state, port, and commodity data. BTS has scheduled the release of October TransBorder numbers for Jan. 5.
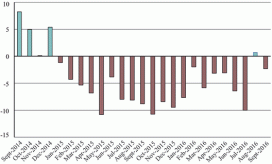
Value Of Monthly U.S.-NAFTA Freight Flows (Sept. 2016)

Month 2014 2015 2016 Percent Change 2014-2015 Percent Change 2015-2016
January 90,326 89,258 82,430 -1.2 -7.7
February 89,557 85,723 84,038 -4.3 -2.0
March 101,478 96,070 90,462 -5.3 -5.8
April 100,141 93,327 90,380 -6.8 -3.2
May 103,942 92,707 89,840 -10.8 -3.1
June 102,978 99,030 92,671 -3.8 -6.4
July 101,075 92,995 83,725 -8.0 -10.0
August 100,624 92,442 93,126 -8.1 0.7
September 102,245 93,246 91,126 -8.8 -2.3
October 108,243 96,624 -10.7
November 96,252 88,154 -8.4
December 95,811 86,748 -9.5
Year-to-date 892,366 834,799 797,798 -6.5 -4.4
Annual 1,192,671 1,106,325 -7.2
Notes:

Numbers might not add to totals due to rounding. Percent change based on numbers prior to rounding.

Source:

Bureau of Transportation Statistics, TransBorder Freight Data, https://data.bts.gov/stories/s/TransBorder-Freight-Data/myhq-rm6q/

Value Of Monthly U.S.-NAFTA Freight Flows By Mode Of Transportation (Sept. 2016)

Mode September 2015 September 2016 Percent Change September 2015-2016
All Modes Imports 50,497 48,755 -3.4
Exports 42,750 42,371 -0.9
Total 93,246 91,126 -2.3
All Surface Modes Imports 44,473 43,160 -3.0
Exports 34,965 34,785 -0.5
Total 79,438 77,946 -1.9
Truck Imports 31,705 30,100 -5.1
Exports 29,580 28,865 -2.4
Total 61,285 58,965 -3.8
Rail Imports 8,857 9,545 7.8
Exports 4,570 4,953 8.4
Total 13,427 14,498 8.0
Pipeline Imports 3,912 3,515 -10.1
Exports 815 967 18.7
Total 4,726 4,482 -5.2
Vessel Imports 2,678 2,414 -9.8
Exports 2,581 2,487 -3.6
Total 5,258 4,901 -6.8
Air Imports 1,604 1,646 2.7
Exports 2,047 2,127 3.9
Total 3,651 3,773 3.4
Notes:

Numbers might not add to totals due to rounding. Percent changes based on numbers prior to rounding. The value of trade for all modes is not equal to the sum of truck, rail, pipeline, vessel and air modes, it also includes shipments made by mail, foreign trade zones, and other transportation. For additional detail, please refer to the TransBorder web page: https://data.bts.gov/stories/s/TransBorder-Freight-Data/myhq-rm6q/

Source:

Bureau of Transportation Statistics, TransBorder Freight Data, https://data.bts.gov/stories/s/TransBorder-Freight-Data/myhq-rm6q/

Value Of Monthly U.S.-CANADA Freight Flows By Mode Of Transportation (Sept. 2016)

Mode September 2015 September 2016 Percent Change September 2015-2016
All Modes Imports 25,140 23,666 -5.9
Exports 23,155 22,525 -2.7
Total 48,295 46,191 -4.4
All Surface Modes Imports 21,813 20,899 -4.2
Exports 18,460 18,366 -0.5
Total 40,273 39,265 -2.5
Truck Imports 12,884 12,376 -3.9
Exports 15,663 15,171 -3.1
Total 28,547 27,547 -3.5
Rail Imports 5,037 5,024 -0.2
Exports 2,257 2,551 13.0
Total 7,293 7,575 3.9
Pipeline Imports 3,892 3,499 -10.1
Exports 540 644 19.3
Total 4,432 4,143 -6.5
Vessel Imports 1,068 834 -21.9
Exports 884 527 -40.4
Total 1,952 1,361 -30.3
Air Imports 1,048 1,010 -3.5
Exports 1,334 1,355 1.6
Total 2,382 2,365 -0.7
Notes:

Numbers might not add to totals due to rounding. Percent changes based on numbers prior to rounding. The value of trade for all modes is not equal to the sum of truck, rail, pipeline, vessel and air modes, it also includes shipments made by mail, foreign trade zones, and other transportation. For additional detail, please refer to the TransBorder web page: https://data.bts.gov/stories/s/TransBorder-Freight-Data/myhq-rm6q/

Source:

Bureau of Transportation Statistics, TransBorder Freight Data, https://data.bts.gov/stories/s/TransBorder-Freight-Data/myhq-rm6q/

Top Commodity Transported between the U.S. and Canada for Each Mode of Transportation, September 2016

Mode Commodities Exports Imports Total
All Modes Vehicles and Parts 4.2 5.1 9.3
Truck Vehicles and Parts 2.6 2.6 5.2
Rail Vehicles and Parts 1.4 2.5 3.9
Pipeline Mineral Fuels 0.6 3.5 4.1
Vessel Mineral Fuels 0.3 0.6 0.9
Air Electrical Machinery 0.3 0.2 0.4
Notes:

Import and export numbers might not add to totals due to rounding.

Source:

 Bureau of Transportation Statistics, TransBorder Freight Data

Value Of Monthly U.S.-MEXICO Freight Flows By Mode Of Transportation (Sept. 2016)

Mode September 2015 September 2016 Percent Change September 2015-2016
All Modes Imports 25,356 25,089 -1.1
Exports 19,595 19,846 1.3
Total 44,951 44,935 -0.04
All Surface Modes Imports 22,661 22,261 -1.8
Exports 16,505 16,419 -0.5
Total 39,165 38,681 -1.2
Truck Imports 18,821 17,724 -5.8
Exports 13,917 13,694 -1.6
Total 32,737 31,418 -4.0
Rail Imports 3,821 4,521 18.3
Exports 2,313 2,402 3.8
Total 6,134 6,923 12.9
Pipeline Imports 19 16 -15.5
Exports 275 323 17.5
Total 294 339 15.3
Vessel Imports 1,610 1,580 -1.9
Exports 1,697 1,960 15.5
Total 3,306 3,540 7.1
Air Imports 556 636 14.3
Exports 713 772 8.3
Total 1,269 1,408 10.9
Notes:

Numbers might not add to totals due to rounding. Percent changes based on numbers prior to rounding. The value of trade for all modes is not equal to the sum of truck, rail, pipeline, vessel and air modes, it also includes shipments made by mail, foreign trade zones, and other transportation. For additional detail, please refer to the TransBorder web page: https://data.bts.gov/stories/s/TransBorder-Freight-Data/myhq-rm6q/

Source:

Bureau of Transportation Statistics, TransBorder Freight Data, https://data.bts.gov/stories/s/TransBorder-Freight-Data/myhq-rm6q/

Top Commodity Transported between the U.S. and Mexico for Each Mode of Transportation, September 2016

Mode Commodities Exports Imports Total
All Modes Electrical Machinery 3.6 5.5 9.1
Truck Electrical Machinery 2.9 4.5 7.4
Rail Vehicles and Parts 0.4 3.0 3.5
Pipeline Mineral Fuels 0.3 0.0 0.3
Vessel Mineral Fuels 1.2 0.8 2.0
Air Electrical Machinery 0.3 0.2 0.4
Notes:

Numbers might not add to totals due to rounding.

Source:

Bureau of Transportation Statistics, TransBorder Freight Data, https://data.bts.gov/stories/s/TransBorder-Freight-Data/myhq-rm6q/

Bar Chart Showing North American Freight Numbers