
Estimated September 2018 U.S. Airline Traffic Data
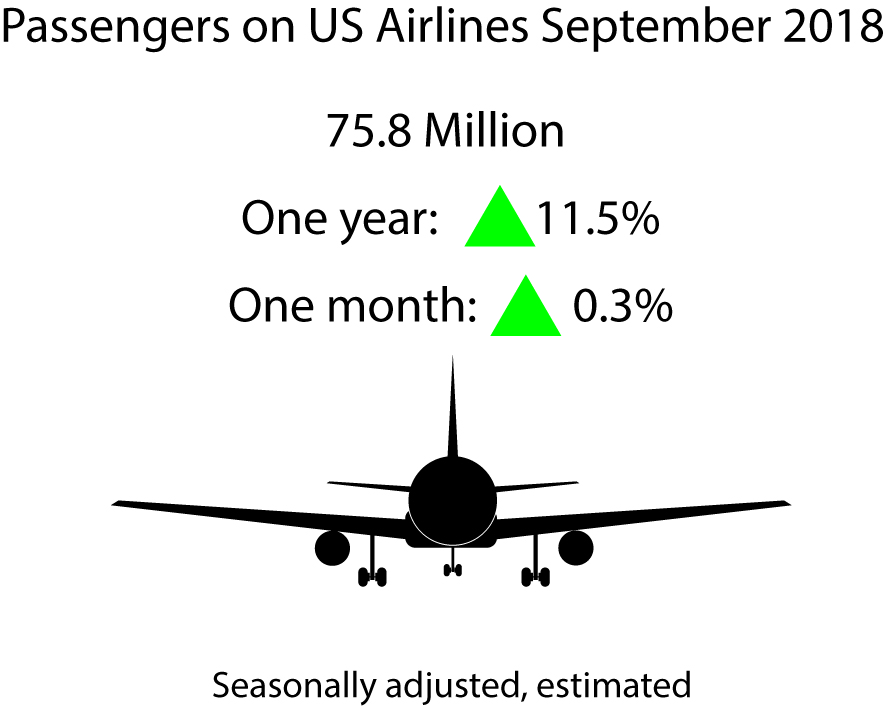
U.S. airlines carried an estimated 75.8 million systemwide (domestic and international) scheduled service passengers, seasonally-adjusted, in September 2018, up 0.3 percent from the August estimate, according to a Bureau of Transportation Statistics’ (BTS) first estimate.
The September air traffic estimate released today is a statistical estimate based on U.S. airlines reported data through July. BTS will release a second forecast of U.S. airlines’ September air traffic on Nov. 16, followed by a release of the reported data on Dec. 16.
Based on the BTS estimates for August and September and reported data through July, the 75.8 million passengers in September would be a seasonally-adjusted all-time high and the eighth consecutive monthly increase.
Figure 1. Seasonally-Adjusted Systemwide Passenger Enplanements on All U.S. Scheduled Airlines (Domestic & International), Sept 2015 - Sept 2018 (Aug-Sept 2018 estimated)
| Enplanements in millions (Seasonally Adjusted) | 1 | |
|---|---|---|
| Sep-15 | 67.2 | 2 |
| Oct-15 | 67.9 | 3 |
| Nov-15 | 67.5 | 4 |
| Dec-15 | 68.0 | 5 |
| Jan-16 | 67.7 | 6 |
| Feb-16 | 67.7 | 7 |
| Mar-16 | 67.1 | 8 |
| Apr-16 | 68.0 | 9 |
| May-16 | 68.9 | 10 |
| Jun-16 | 69.1 | 11 |
| Jul-16 | 68.3 | 12 |
| Aug-16 | 68.0 | 13 |
| Sep-16 | 69.2 | 14 |
| Oct-16 | 69.2 | 15 |
| Nov-16 | 69.5 | 16 |
| Dec-16 | 69.6 | 17 |
| Jan-17 | 69.7 | 18 |
| Feb-17 | 69.6 | 19 |
| Mar-17 | 70.0 | 20 |
| Apr-17 | 70.5 | 21 |
| May-17 | 71.2 | 22 |
| Jun-17 | 71.1 | 23 |
| Jul-17 | 71.6 | 24 |
| Aug-17 | 71.4 | 25 |
| Sep-17 | 68.0 | 26 |
| Oct-17 | 72.1 | 27 |
| Nov-17 | 72.3 | 28 |
| Dec-17 | 72.3 | 29 |
| Jan-18 | 71.6 | 30 |
| Feb-18 | 73.0 | 31 |
| Mar-18 | 73.2 | 32 |
| Apr-18 | 74.2 | 33 |
| May-18 | 74.4 | 34 |
| Jun-18 | 75.3 | 35 |
| Jul-18 | 75.6 | 36 |
| Aug-18 | 75.6 | 37 |
| Sep-18 | 75.8 | 38 |
| 39 |
Most recent two months estimated
One Month Estimate: Estimated August 2018 to estimated September 2018 domestic enplanements increased 0.3 percent while enplanements on international flights to and from the U.S. were virtually unchanged for a 0.3 systemwide increase.
One Year Estimate: Reported September 2017 domestic enplanement to estimated September 2018 domestic enplanements rose 11.8 percent while international enplanements rose 9.2 percent for an 11.5 percent systemwide increase.
Three Year Estimate: Reported September 2015 domestic enplanements to estimated September 2018 domestic enplanements rose 13.4 percent while international enplanements rose 8.2 percent for a 12.7 percent systemwide increase.
Unadjusted: Systemwide, domestic and international enplanements all reached estimated highs for the month of September compared to reported data for previous years
The September air traffic estimate released today is a forecast based on data reported by U.S. airlines through July. BTS will release a second estimate of U.S. airlines’ September air traffic on Nov. 16, followed by a release of the reported data on Dec. 16.
For the August and September estimates and for data filed through July, see accompanying tables. For the complete database of reported data, see Traffic .
U.S. Airlines Reported Data for July
U.S. airlines carried a new high of 75.3 million systemwide (domestic and international) scheduled service passengers, seasonally-adjusted, in July 2018 up 0.3 percent from June, for the sixth consecutive monthly increase.
One Month: June 2018 to July 2018 domestic enplanements increased 0.4 percent while enplanements on international flights to and from the U.S. fell 0.5 percent for a 0.3 systemwide increase.
One Year: July 2017 July 2018 domestic enplanements rose 5.9 percent while international enplanements rose 2.3 percent for a 5.4 systemwide increase.
Three Years: July 2015 July 2018 domestic enplanements rose 13.4 percent while international enplanements rose 8.9 percent for a 12.8 systemwide increase.
Unadjusted: Systemwide, domestic and international enplanements all reached all-time highs for any month.
Additional Bureau of Transportation Statistics (BTS) air traffic data:
Seasonally-adjusted
New seasonally-adjusted estimated all-time highs in September 2018
Passenger enplanements: Systemwide and domestic passenger enplanements reached new seasonally-adjusted all-time highs based on the estimate compared to reported data through July.
Revenue passenger-miles: Domestic revenue passenger miles (RPMs) reached new seasonally-adjusted all-time highs based on the estimate compared to reported data through July.
Load Factor
Estimated systemwide load factor (85.5) reached a new estimated seasonally-adjusted all-time high compared to reported data through July, up 0.6 points from the previous estimated high in August 2018 (84.9). Domestic load factor reached a new seasonally-adjusted all-time high (86.8) and international load factor declined.
Load factor is a measure of the use of aircraft capacity that compares the system use, measured in RPMs as a proportion of system capacity, measured ASMs.
The estimated seasonally-adjusted load factor rose from August (84.9) to September (85.5) because estimated passenger travel in RPMs was virtually unchanged while estimated system capacity was reduced (0.7 percent decline in ASMs).
Seasonally-adjusted trends are for the time period January 2000 to present based on data reported by U.S. airlines through July and BTS estimates for the two most recent months. Additional data, including domestic and international numbers, can be found on the seasonally-adjusted data page.
Unadjusted Trends
Figure 2. Unadjusted Systemwide Passenger Enplanements on All U.S. Scheduled Airlines (Domestic & International), Sept 2015 - Sept 2018 (Aug-Sept 2018 estimated)
| Enplanements in millions (Unadjusted) | 1 | ||||
|---|---|---|---|---|---|
| Sep-15 | 63.7 | 2 | |||
| Oct-15 | 68.7 | 3 | |||
| Nov-15 | 64.6 | 4 | |||
| Dec-15 | 66.4 | 5 |
Most recent two months estimated
One Month Estimate: Estimated August 2018 estimated to estimated September 2018 estimated domestic enplanements fell 10.0 percent while enplanements on international flights to and from the U.S. fell 20.4 percent for an 11.4 percent systemwide decline.
One Year Estimate: Reported September 2017 domestic enplanements to estimated September 2018 domestic enplanements rose 11.8 percent while international enplanements rose 9.9 percent for an 11.6 percent systemwide increase.
Three Year Estimate: Reported September 2015 domestic enplanements to estimated September 2018 estimated domestic enplanements rose 14.1 percent while international enplanements rose 10.2 percent for a 13.7 systemwide increase.
Revenue passenger-miles: Systemwide, international, and domestic revenue passenger miles (RPMs) reached new estimated highs for the month of September compared to reported data for previous years.
Available seat-miles: Systemwide, international, and domestic available seat miles (ASMs) reached new estimated highs for the month of September compared to reported data for previous years.
Load Factor:
Systemwide load factor (85.5) and domestic load factor (86.6) reached new estimated all-time highs for the month of September compared to reported data for previous years. International load factor (83.0) was down 0.6 points from the all-time September high (83.6) reached in 2010.
Unadjusted load factor rose from the reported September 2017 (81.7 percent) to the estimated September 2018 (85.5 percent) because estimated passenger travel grew faster (10.9 percent increase in RPMs) than estimated system capacity (5.9 percent increase in ASMs).
Unadjusted trends are for the time period January 1996 to present based on data reported by U.S. airlines through July and BTS estimates for the two most recent months. Data through July are available at Customize Table. Reported data and estimates for the two most recent months can be downloaded from the seasonally-adjusted data page.
Explanation of estimates
Estimates derived from a forecast of the data. The first estimate is a 2-month ahead forecast of the data. When an additional month of data become available, BTS uses the data to re-forecast the month and releases a second estimate. BTS performs the forecasting using the Census X-12 procedure in SAS – a statistical software program.
Explanation of seasonal adjustment
When the primary purpose is to examine monthly shifts in transportation services output and analyze short-term trends, the variation introduced by normal seasonal changes must be removed from the data. Transportation is highly seasonal, and without adjustment, the data do not give an accurate picture of underlying changes in aviation, passenger travel.
Seasonal adjustment of the data removes the seasonal events that follow a regular seasonal pattern. Changes that are not due to seasonality, such as a change in air travel resulting from economic conditions become more readily apparent.
The aviation data are seasonally adjusted for the effects of trading day, moving holidays, and data outliers.
See Seasonal Adjustment for methodology and additional explanation.
Reporting Notes
Data are compiled from monthly reports filed with BTS by commercial U.S. air carriers detailing operations, passenger traffic and freight traffic. This release includes July data received by BTS from 80 U.S. carriers as of Oct. 3 for U.S. carrier scheduled civilian operations.
See the BTS Airlines and Airports page for additional scheduled service numbers through July for U.S. and foreign airlines. International data by origin and destination is available through April.
BTS has scheduled Nov. 16 for the release of the first estimate of October air traffic data, the second estimate of the September air traffic data and reported data through August.
None of the data are from samples. Measures of statistical significance do not apply to the complete air traffic data.