
National Transportation Statistics 9/4/19 Update, Shares of U.S. Energy Consumption and other categories
Wednesday, September 25, 2019
Wednesday, September 4, 2019 - National Transportation Statistics (NTS) – a guide to historical national-level transportation trends was updated today.
Recently Updated Tables by Topics:
Transportation and the Economy
- Contributions to U.S. Gross Domestic Product (GDP): Selected Industries (3-7)
- National Transportation and Economic Trends (3-10)
Transportation and Consumer Expenditures
- Producer Price Indices for Transportation Services and Warehousing Services (3-13)
Transportation Revenues, Employment, and Productivity
- Labor Productivity Indices for Selected Transportation Industries (3-28)
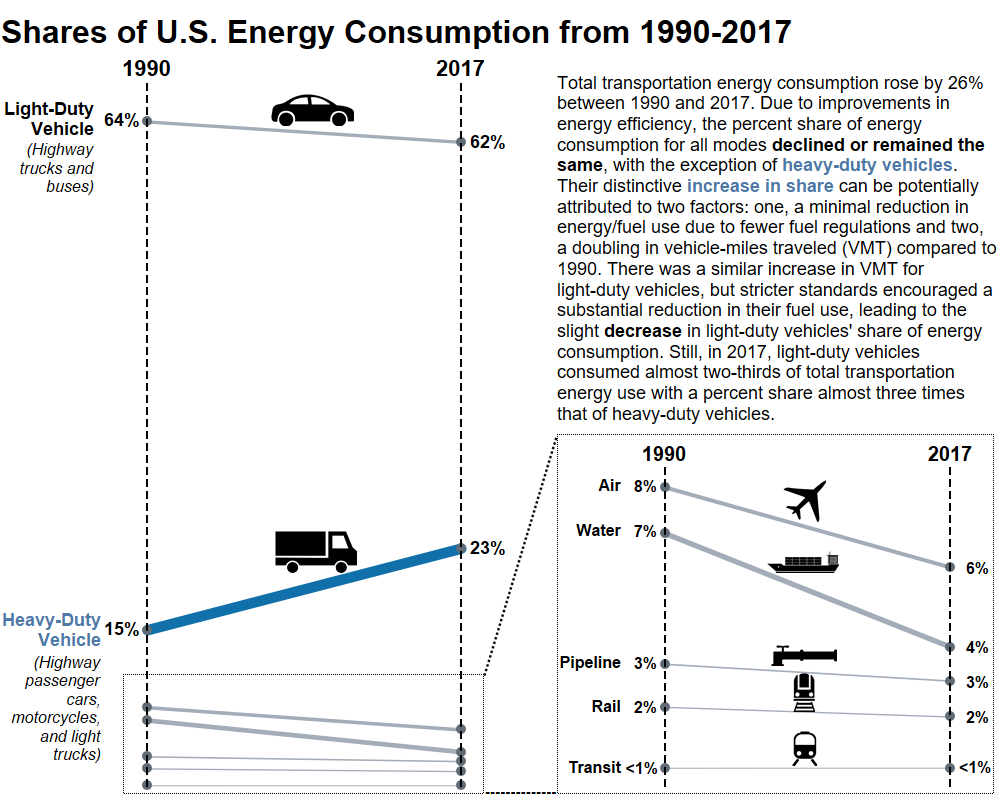
Transportation Energy Consumption by Mode
- Energy Consumption by Mode of Transportation (4-6, 4-6M)
- Certificated Air Carrier Fuel Consumption and Travel (4-8, 4-8M)
- Motor Vehicle Fuel Consumption and Travel (4-9, 4-9M)
- Light Duty Vehicle, Short Wheel Base and Motorcycle Fuel Consumption and Travel (4-11, 4-11M)
- Light Duty Vehicle, Long Wheel Base Fuel Consumption and Travel (4-12, 4-12M)
- Single-Unit 2-Axle 6-Tire or More Truck Fuel Consumption and Travel (4-13, 4-13M)
- Combination Truck Fuel Consumption and Travel (4-14, 4-14M)
- Bus Fuel Consumption and Travel (4-15, 4-15M)
Transportation Energy Intensity and Fuel Efficiency
- Energy Intensity of Passenger Modes (4-20, 4-20M)
- Energy Intensity of Passenger Cars, Other 2-Axle 4-Tire Vehicles, and Motorcycles (4-22, 4-22M)
Air Pollution
- Air Pollution Trends in Selected Metropolitan Statistical Areas (4-51)
- U.S. Carbon Dioxide Emissions from Energy Use by Sector (4-53)
Water Pollution, Noise, and Solid Waste
- Petroleum Oil Spills Impacting Navigable U.S. Waters (4-54)
- Number of People Residing in Areas of Significant Noise Exposure Around U.S. Airports (4-57)
Modal Profiles
Contact: Dave Smallen (202) 366-5568, david.smallen@dot.gov.