


Second Quarter 2026 Average Air Fare Increased 2.0% from First Quarter 2026
BTS 26-73
Note: Due to a number of carriers re-submitting their data to BTS, there are updates to the data in this release.
In the third quarter of 2025, the U.S. Department of Transportation (DOT) transitioned to a new collection of passenger tickets, and launched the Origin-Destination Survey of Airline Passengers (OD40) program. Prior to the third quarter (Q3) of 2025, the ticket sampling collection was performed on a 10% basis. Beginning July 1, 2025, the ticket sampling collection changed to a 40% basis of all U.S. air carriers that operate scheduled passenger service. The Domestic Average Fares in this report and data tables are based on the 40% sampling. Fares prior to Q3 2025 will remain based on the 10% ticket sampling. More information about the transition to the OD40 can be found here: BTS OD-40 page.
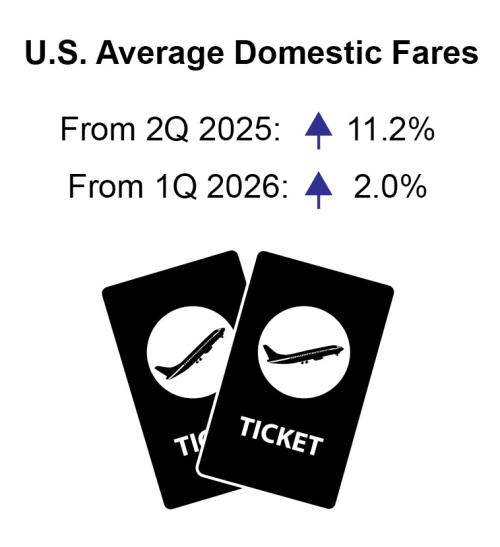
The average U.S. domestic air fare increased in the second quarter of 2026 to $445, up 2.0% from the first quarter 2026 inflation-adjusted fare of $436.
Itinerary Fares: Round-trips, but includes one-way tickets if no return is purchased.
Breakout of trip types: one-way, 45% ($312); round-trip, 55% ($549).
Fare calculations by BTS
*Based on a sample of approximately 40% of tickets sold.
Total ticket value: The price charged by airlines at time of ticket purchase.
Included: All fees and charges levied by an air carrier required for the passenger to board the aircraft. Also, additional taxes and fees levied by an outside entity at time of ticket purchase.
Not included: Fees for optional services, such as baggage fees, seat upgrades, and selecting an assigned seat on the aircraft.
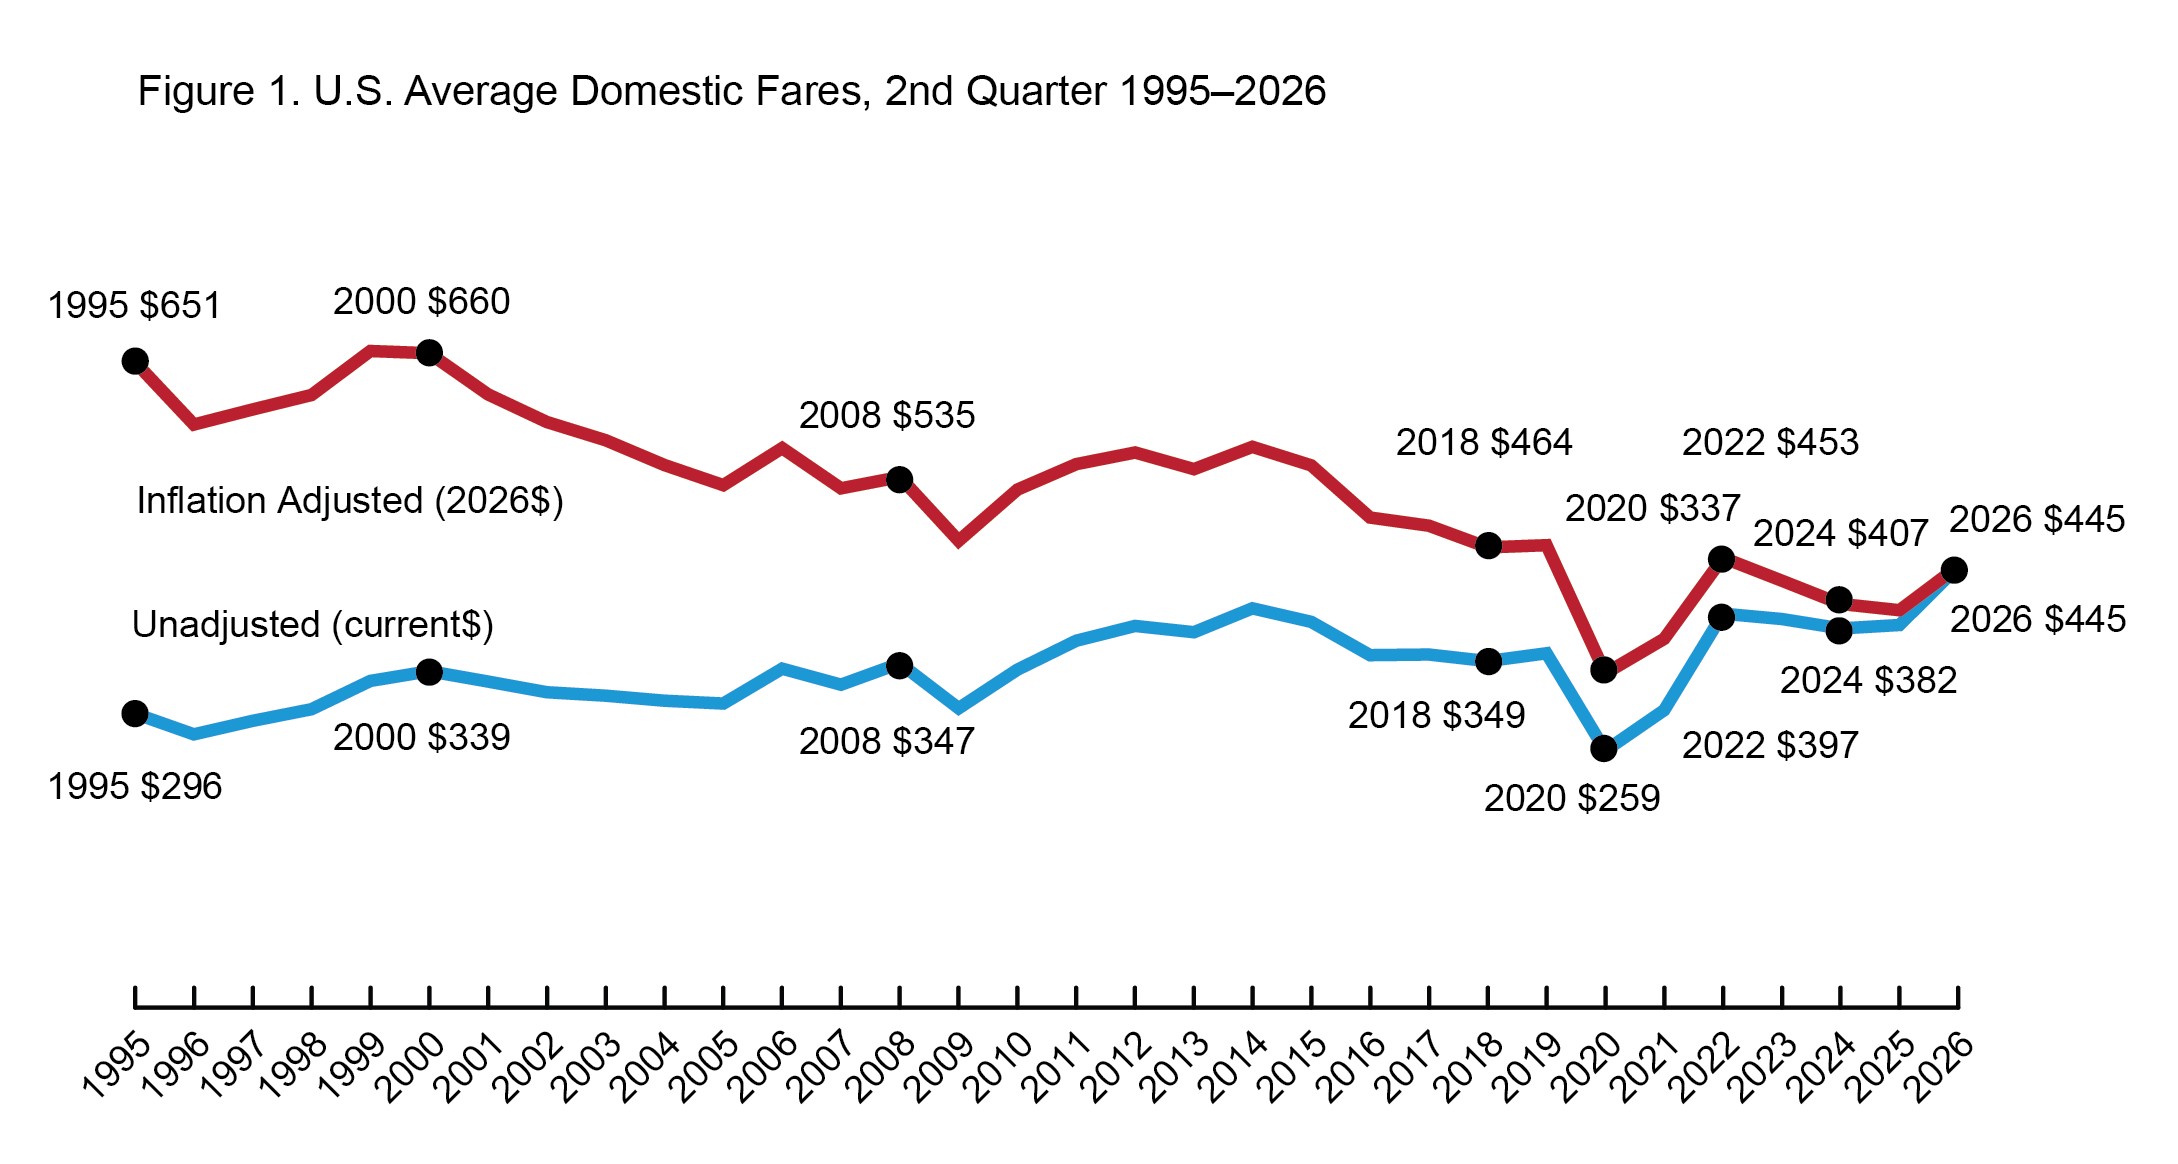
Note: Q3 2025 and forward represents the new OD40 Collection fares
Inflation-Adjusted Average Air Fares
Second Quarter 2026 fare ($445):
Compared to all second quarters: Down 32.7% from the highest 2Q fare, $662 in 1999.
Compared to all quarters: Down 33.8% from the highest fare for any quarter, $673 in 1Q 1999.
Start of BTS records: Down 32.2% from 1Q 1995 ($657).
Recent high: Down 1.8% from 2Q 2022 ($453).
Recent low: Up 16.7% from 3Q 2025 ($381).
All-time low: Up 41.5% from the previous low 3Q 2020 ($315).
All-time second quarter low: Up 32.2% from the previous low 2Q 2020 ($337).
Other Revenue: In recent years, airlines have increasingly obtained additional revenue from passenger fees, as well as from other sources. U.S. passenger airlines collected 72.5% of total operating revenue of $101.5 billion from passenger fares during the first six months of 2026, down from 88.5% in 1990.
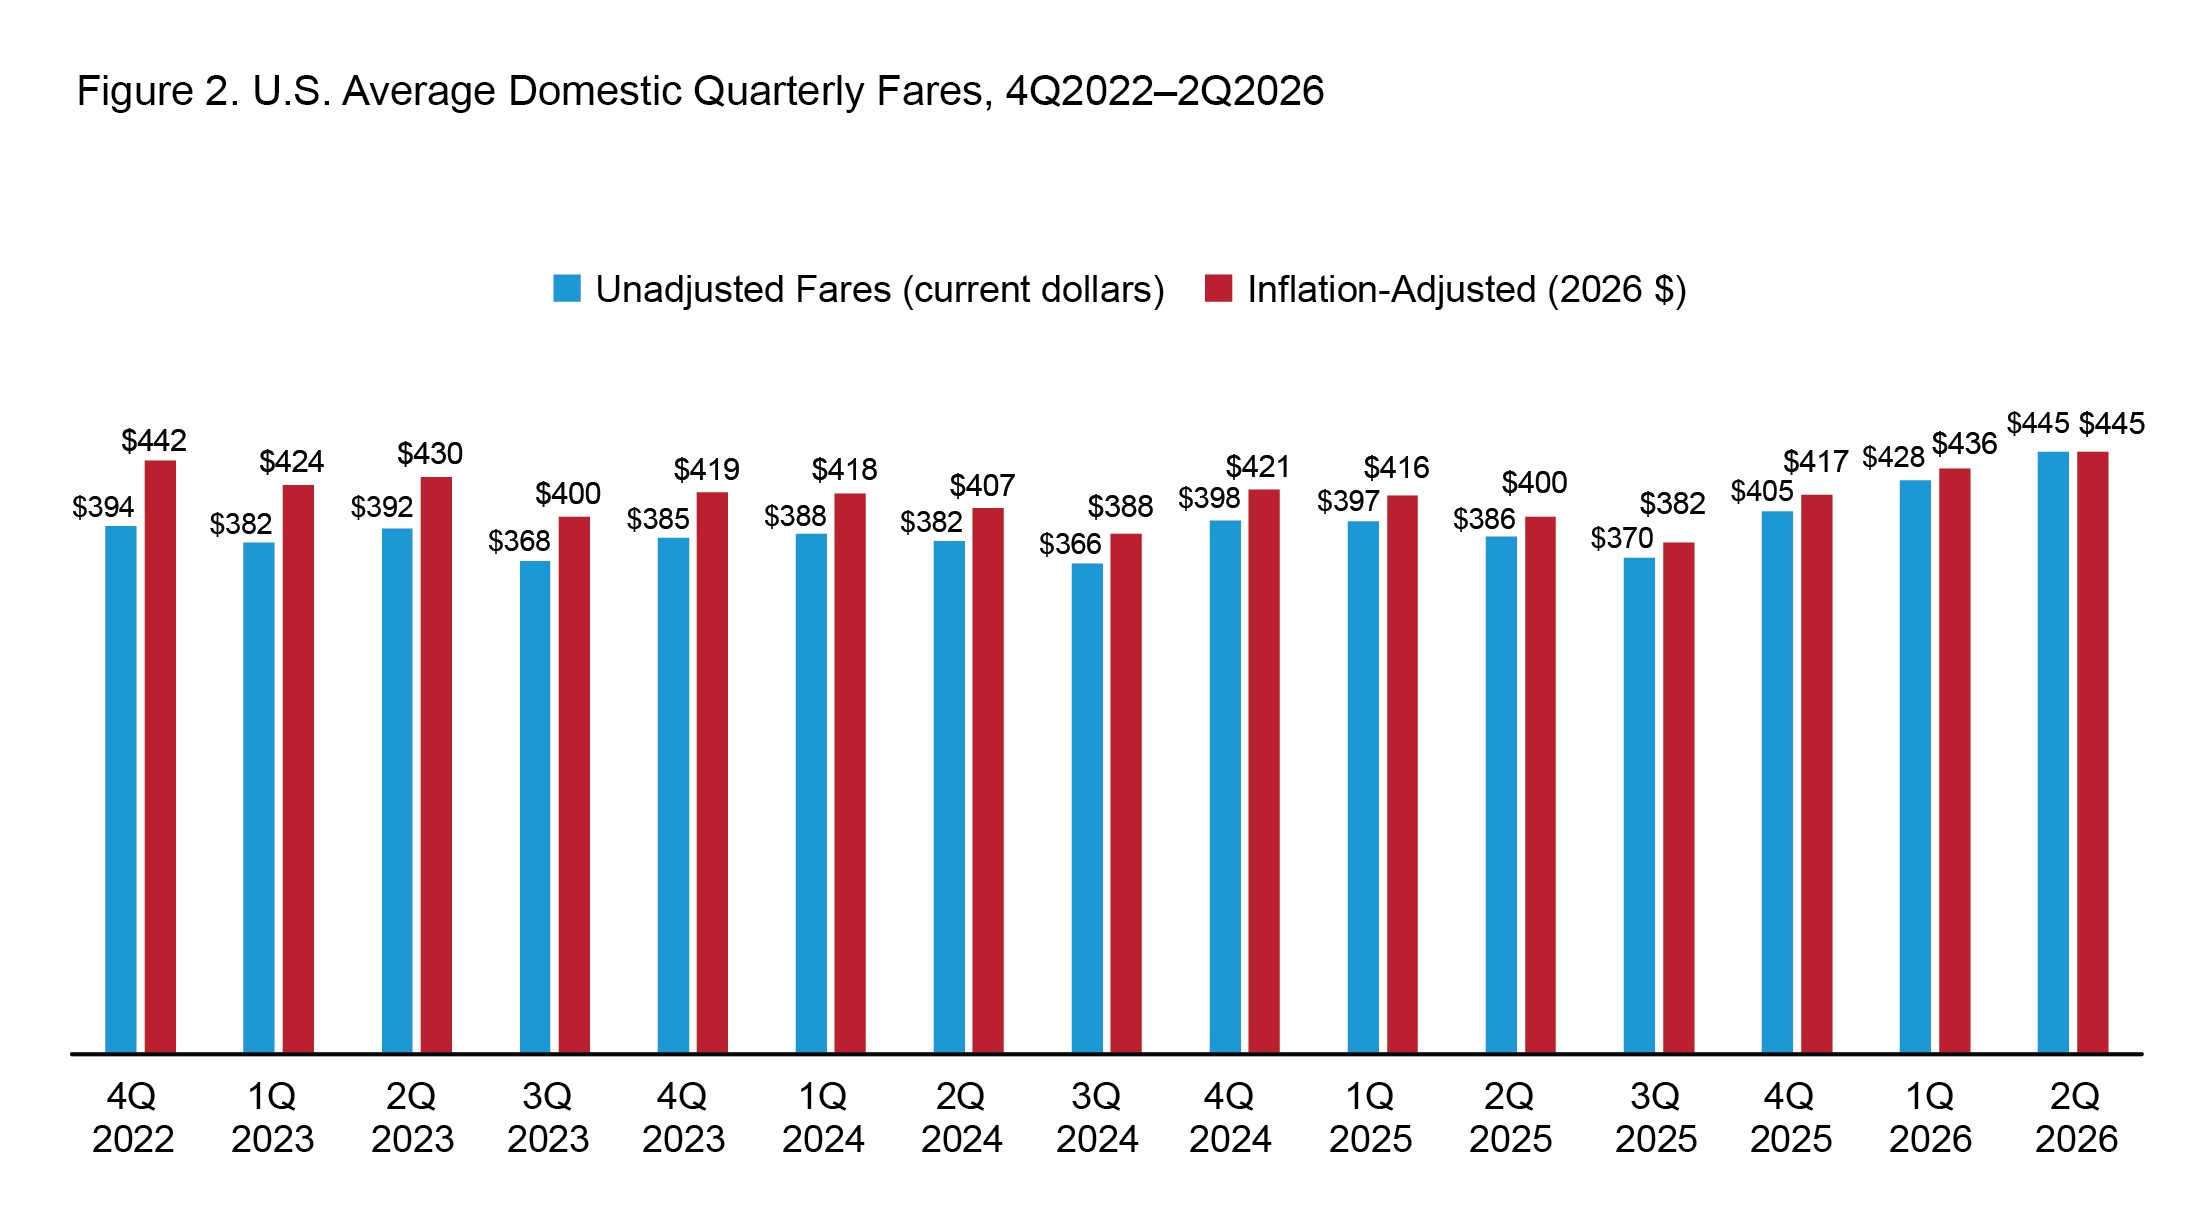
Unadjusted Average Air Fares
Second Quarter 2026 fare ($445):
Trend: Up 4.1% from 1Q 2026 ($428).
Compared to all second quarters: This is the highest Quarter 2 fare recorded, $445.
Compared to all quarters: This is the highest unadjusted Quarter fare recorded, $445.
Start of BTS records: Up 50.0% from 1Q 1995 ($297) (compared to 119.5% consumer price increase).
Recent low: Up 41.8% from 3Q 2025 ($314).
Recent high: Up 4.1% from 1Q 2026 ($428).
All-time low: Up 82.0% from 3Q 2020 ($245).
All-time second-quarter low: Up 71.9% from 2Q 2020 ($259).
Fares by Airport
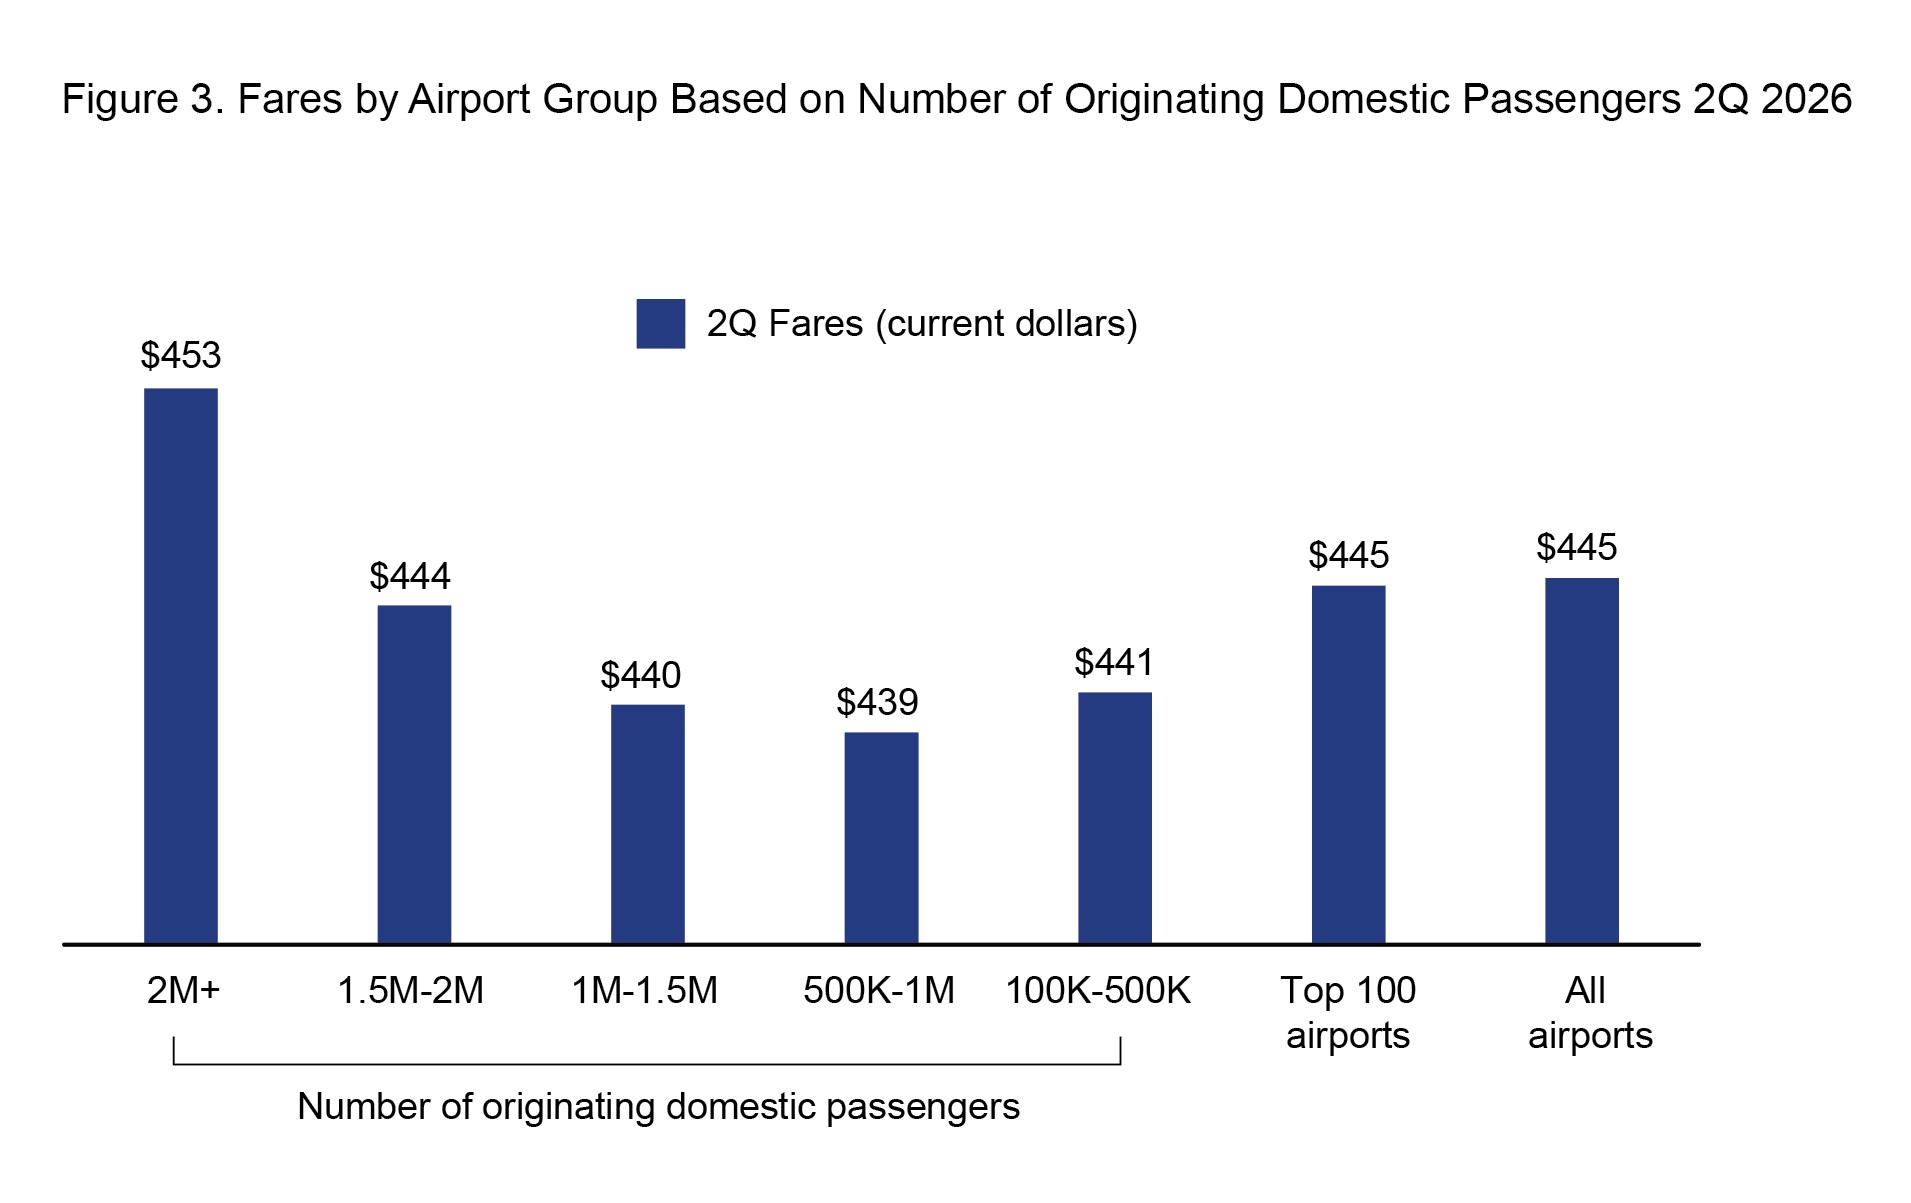
Fares by airport group:
Highest: 11 airports with greater than 2.0 million plus originating passengers ($453)
Lowest: 22 airports with 500,000-999,999 million originating passengers ($438)
Additional data: see Top 100 Airports or All Airports.
The next press release date for third quarter of 2026 will occur on or around January 8, 2027.
To receive updates from BTS directly to your email, please consider subscribing to our GovDelivery service.