
Third Quarter 2019 Air Fare Data
U.S. domestic air fares in the third quarter of 2019 of $345 were the lowest on record, inflation adjusted, based on Bureau of Transportation Statistics (BTS) records dating from 1995. The third-quarter 2019 fares were down 1.2% from the previous low of $349 in the third quarter of 2018.
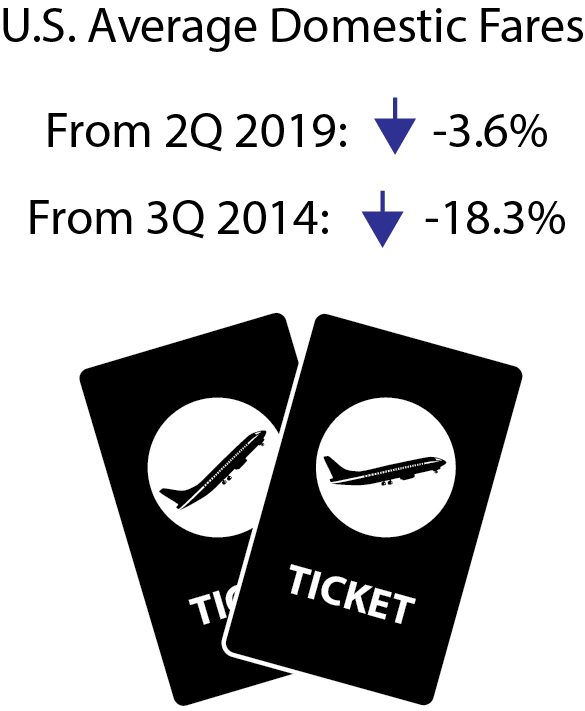
Adjusted for inflation, (constant 2019 dollars) the 3Q 2019 air fare was:
- Down 1.2% from 3Q 2018 ($349)
- Down 3.6% from 2Q 2019 ($358). The second-quarter fare was revised from $364 in the previous release after Frontier Airlines refiled second-quarter data. Frontier’s revised second-quarter and third-quarter data are included in this release.
- Down 18.3% from 3Q 2014 ($422)
Source: Bureau of Transportation Statistics, BTS Air Fares, Origin and Destination Survey
Figure 1. U.S. Average Domestic Fares, 3rd Quarter 1995-2019
| Unadjusted Fares (current dollars) | Inflation-Adjusted (2019$) | 1 | |
|---|---|---|---|
| 1995 | 288 | 491 | 2 |
| 1996 | 269 | 451 | 3 |
| 1997 | 282 | 458 | 4 |
| 1998 | 315 | 486 | 5 |
| 1999 | 317 | 497 | 6 |
| 2000 | 337 | 503 | 7 |
| 2001 | 303 | 463 | 8 |
| 2002 | 303 | 444 | 9 |
| 2003 | 312 | 438 | 10 |
| 2004 | 297 | 413 | 11 |
| 2005 | 306 | 401 | 12 |
| 2006 | 330 | 414 | 13 |
| 2007 | 328 | 401 | 14 |
| 2008 | 359 | 405 | 15 |
| 2009 | 307 | 369 | 16 |
| 2010 | 340 | 395 | 17 |
| 2011 | 361 | 412 | 18 |
| 2012 | 367 | 416 | 19 |
| 2013 | 392 | 419 | 20 |
| 2014 | 399 | 422 | 21 |
| 2015 | 374 | 400 | 22 |
| 2016 | 345 | 366 | 23 |
| 2017 | 336 | 351 | 24 |
| 2018 | 343 | 349 | 25 |
| 2019 | 345 | 345 | 26 |
| 27 |
Source: Bureau of Transportation Statistics, Origin and Destination Survey
Figure 2. Fares by Airport Group based on Number of Originating Domestic Passengers 3Q 2019
| Originating Domestic Passengers | 3Q Fares (current dollars) | 1 |
|---|---|---|
| 2M+ | $352 | 2 |
| 1.5M-2M | $321 | 3 |
| 1M-1.5M | $338 | 4 |
| 500K-1M | $342 | 5 |
| 100K-500K | $355 | 6 |
| Top 100 Airports | $348 | 7 |
| All Airports | $345 | 8 |
| 9 |
Bureau of Transportation Statistics, Origin and Destination Survey
Additional data: see Top 100 Airports or All Airports. Fourth Quarter 2019 average fare data will be released April 21.
Standard error: Results for average fares are based on the BTS Origin & Destination Survey, a 10% sample of airline tickets used during the quarter. Averages for airports with smaller samples may be less reliable.
Note: Results for average fares are based on the BTS Origin & Destination Survey, a 10 percent sample of airline tickets used during the quarter. For results based on all itinerary fares, the standard error is 0.28. The 90% confidence interval ranges from $344.64 to $345.54. For results based on round-trip fares, the standard error is 0.35. The 90% confidence interval ranges from $420.55 to $421.70. For results based on one-way fares, the standard error is 0.33. The 90% confidence interval ranges from $249.44 to $250.54.