
Updates to National Transportation Statistics Include Time Lost and Fuel Wasted in Road Congestion and Other Historical Tables
Archived information is provided for reference, research, or recordkeeping purposes. It is not subject to the Bureau of Transportation Statistics Web Standards and has not been altered or updated since its publication date. Please "contact us" to request a format other than those available.
BTS today released its monthly update to National Transportation Statistics (NTS), a guide to historical transportation trends at the national level.
This month’s featured table, Annual Highway Congestion Cost by Urban Area, is part of the NTS section on transportation system performance. Related tables also in this round of updates include the Urban Area Travel Time Index, Hours of Highway Traffic Delay, and Wasted Fuel Due to Congestion.
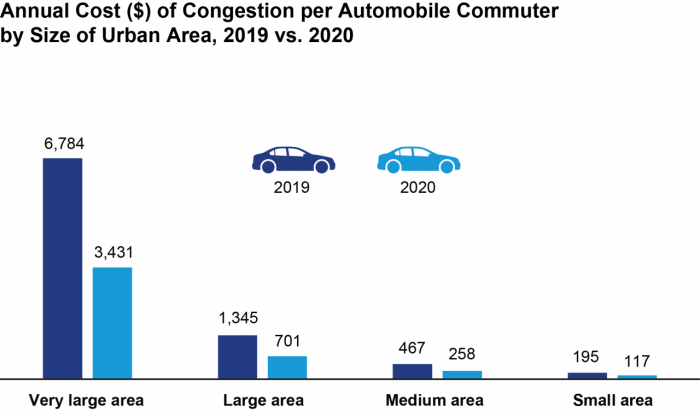
Source: Texas A&M Transportation Institute, 2021 Urban Mobility Report, (College Station, TX: 2021), available at https://mobility.tamu.edu as of Sept. 9, 2021.
Recently Updated Tables by NTS Topic:
Social and Economic Characteristics of the United States
- Social and Economic Characteristics (Table A)
System Performance
- Annual Person-Hours of Highway Traffic Delay Per Auto Commuter (1-69)
- Travel Time Index (1-70)
- Annual Highway Congestion Cost (1-72)
Transportation and Consumer Expenditures
- Producer Price Indices for Transportation Services and Warehousing Services (NAICS) (3-13)
- Producer Price Indices for Transportation Equipment, NAICS Basis (3-14)
Transportation Revenues, Employment, and Productivity
- Average Freight Revenue per Ton-Mile (3-21)
- Labor Productivity Indices for Selected Transportation Industries (3-28)
Transportation Energy Intensity and Fuel Efficiency
Modal Profiles