
Freight
Legacy ID
1541
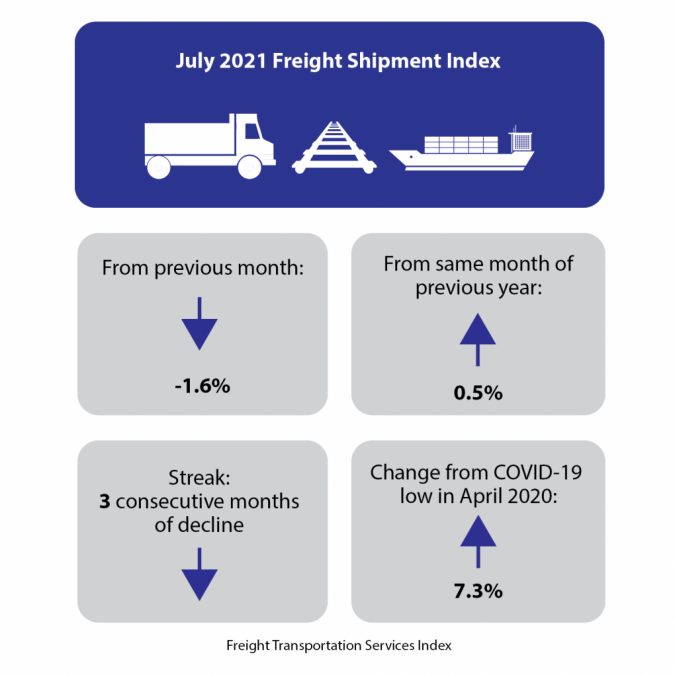
July 2021 Freight Transportation Services Index (TSI)
BTS 54-21
Contact: Todd Solomon
todd.solomon@dot.gov
Tel: 202-366-0573
North American Freight Data Reveals Growth in Unsung Trade Modes
There has been a lot of attention lately on challenges to the supply chain since the onset of COVID-19, most of it focused on goods flowing into and out of West Coast ports. One aspect of U.S. trade attracting less attention is North American freight flows, which have increased since the pandemic...North American Transborder Freight up 41% in June 2021 from June 2020, up 12% since Pre-Pandemic June 2019
BTS 53-21
BTS Contact: Todd Solomon
todd.solomon@dot.gov
![]()
Transborder freight between the U.S. and North American countries (Canada and Mexico) in June 2021:
Freight Flows by Highway, Railway, and Waterway: 2016
This map is included in the Transportation Statistics Annual Report 2018 publication.
Ratio of Outbound to Inbound Domestic Shipments by Value: 2016
This map is included in the Transportation Statistics Annual Report 2018 publication.
Ratio of Outbound to Inbound Domestic Shipments by Weight: 2016
This map is included in the Transportation Statistics Annual Report 2018 publication.
Top 25 U.S.-International Freight Gateways by Value of Shipments: 2016
This map is included in the Transportation Statistics Annual Report 2018 publication.
Top 25 Water Ports by TEU: 2017
This map is included in the Transportation Statistics Annual Report 2018 publication.
Top 25 Water Ports by Tonnage: 2017
This map is included in the Transportation Statistics Annual Report 2018 publication.