Intermodal
Legacy ID
1521

Freight Activity in the U.S Expected to Grow Fifty Percent by 2050
The U.S. Department of Transportation's Bureau of Transportation Statistics(BTS) and Federal Highway Administration (FHWA) today jointly released a new version of freight flows forecast data from the Freight Analysis Framework (FAF), the most comprehensive, publicly available, national-level...North American Transborder Freight Decreases 3.4% in September 2021 from August 2021, Up 7.7% since Pre-Pandemic September 2019
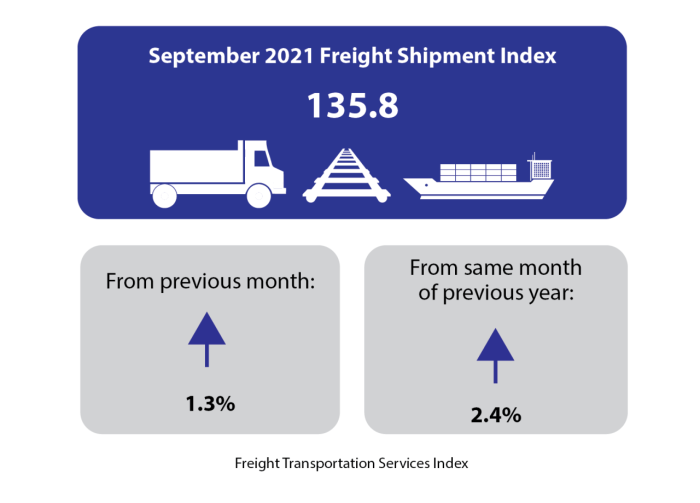
The value of transborder freight between the U.S. and North American countries (Canada and Mexico) reached $109.2 billion in September 2021 according to data released by the Bureau of Transportation Statistics. The September figure is a 3.4% decrease from August 2021, an increase of 13.3% from...September 2021 Freight Transportation Services Index (TSI)
BTS 67-21
Contact: Todd Solomon
Tel: 202-366-0573
todd.solomon@dot.gov