Economics, employment, and finance
Legacy ID
1546
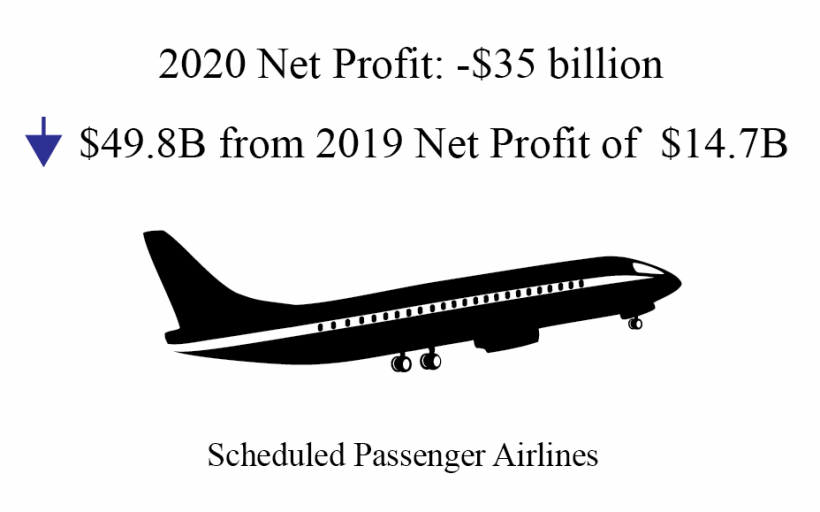
U.S. Airlines 2020 Net Profit Down $35 Billion from 2019
BTS 30-21
BTS Contact: Dave Smallen
david.smallen@dot.gov
North American Transborder Freight down 0.1% in February 2021 from February 2020
BTS 29-21
Wednesday, April 28, 2021
BTS Contact: Dave Smallen
Tel: 202-366-5568
david.smallen@dot.gov
![]()
Transborder freight between the U.S. and North American countries (Canada and Mexico) in February 2021:
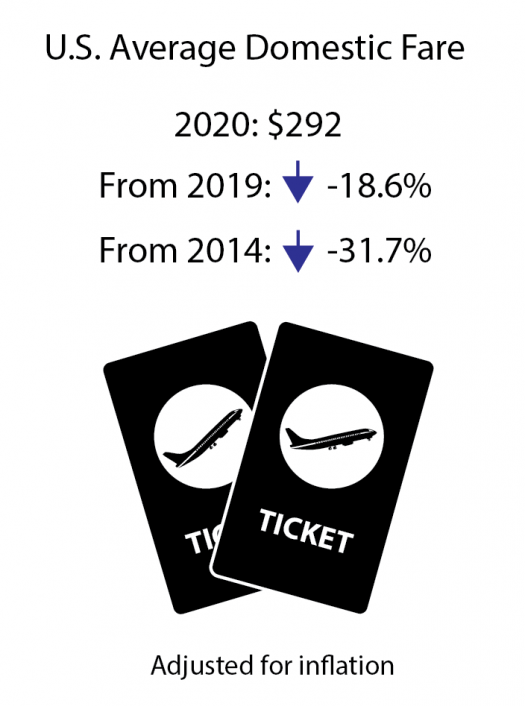
Average Air Fares Dropped to All-Time Low in 2020
Release Number: BTS 27-21
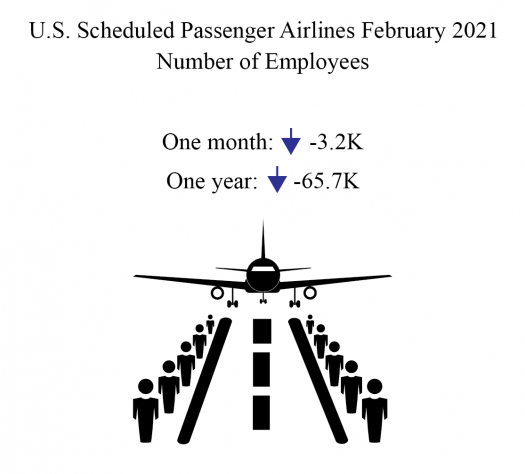
February 2021 U.S. Passenger Airline Employment Down Over 3,000 Compared to January 2021
Release Number: 26-21