
BTS National Transportation Statistics Updated
Thursday, March 21, 2019
Tuesday, March 5, 2019 - National Transportation Statistics (NTS) – a web-only reference guide to national-level transportation data was updated today.
Updated tables:
-
Transportation System
- Number of Air Carriers, Railroads, Marine Vessel Operators, and Pipeline Operators (Table 1-11)
- Condition of Highway Bridges (1-28)
- Class I Railroad Locomotive Fleet by Year Built (1-32)
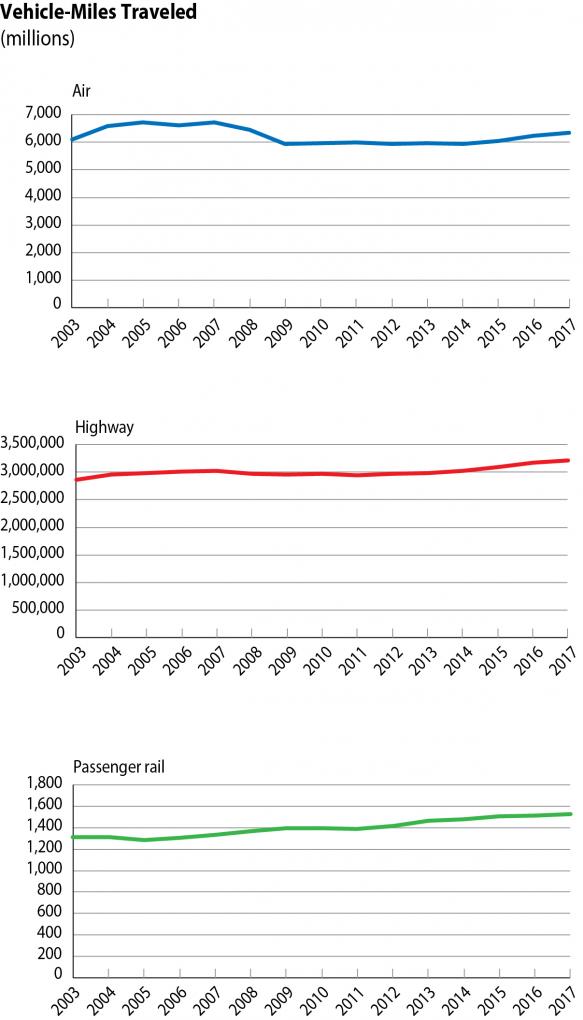
- Vehicle-Miles Traveled and VMT per Lane-Mile by Functional Class (1-35, 1-36)
- Passengers, Containers, and Vehicles Entering at U.S.-Canada and U.S.-Mexico Border Gateways (1-47, 1-48, 1-52, 1-53, 1-54, 1-55)
- Causes of Aviation Departure and En Route Delays (FAA-Cited) (1-67)
-
Safety
- Hazardous Materials Fatalities, Injuries, Accidents, and Property Damage (2-6)
- Motor Vehicle Fatalities, Vehicle-Miles, and Fatality Rates by Highway Functional System (2-18)
- Hazardous Liquid and Natural Gas Pipeline Safety and Property Damage (2-50)
-
Economy
- Producer Price Indices for Selected Transportation and Warehousing Services (3-13);
- Producer Price Indices for Transportation Equipment (3-14)
- Average Passenger Revenue per Passenger-Mile for Air Carrier, Commuter Rail, and Intercity/Amtrak (3-20)
- Average Freight Revenue Per Ton-mile for Air and Rail (3-21)
- Median Weekly Earnings of Full-Time Wage and Salary Workers in Transportation by Detailed Occupation (3-26)
-
Energy and the Environment
- Domestic Demand for Gasoline (4-7)
- Class I Rail Freight Fuel Consumption and Travel (4-17)
- Amtrak Fuel Consumption and Travel (4-18)
- Energy Intensity of Class I Railroad Freight Service (4-25)
Contact: Dave Smallen (202) 366-5568, david.smallen@dot.gov.