
World Motor Vehicle Production in National Transportation Statistics 9/25/19 Update
Friday, September 27, 2019
Wednesday, September 25, 2019 - National Transportation Statistics (NTS) – a guide to historical national-level transportation trends was updated today.
Recently Updated Tables by Topics:
Vehicle, Aircraft, and Vessel Inventory
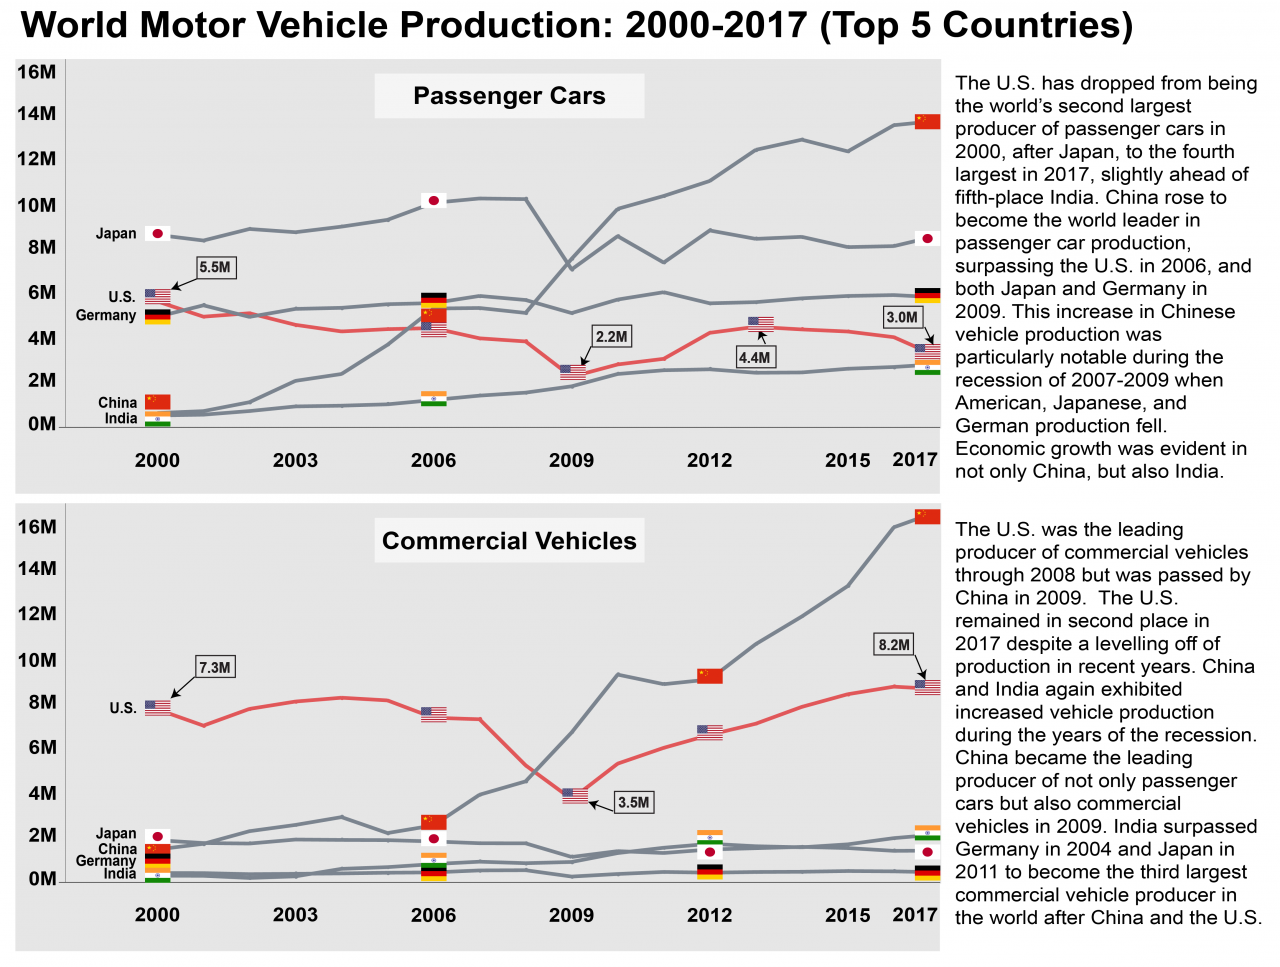
- World Motor Vehicle Production, Selected Countries (1-23)
System Performance
- Amtrak On-Time Performance Trends and Hours of Delay by Cause (1-73)
Transit Safety
- Transit Safety Transit Safety and Property Damage Data (2-32)
- Transit Safety Data by Mode for All Reported Incidents (2-34)
Railroad Safety
- Railroad and Grade-Crossing Injured Persons by Victim Class (2-40)
- Train Fatalities, Injuries, and Accidents by Type of Accident (2-41)
- Railroad Passenger Safety Data (2-42)
Transportation and the Economy
- Contributions to U.S. Gross Domestic Product: Selected Industries (Chained 2012 dollars) (3-8)
Government Finance
- Federal, State, and Local Government Transportation-Related Revenues and Expenditures (Current dollars) (3-29)
- Federal, State, and Local Government Transportation-Related Revenues and Expenditures (Chained 2012 dollars) (3-30)
- Summary of Transportation Revenues and Expenditures from Own Funds and User Coverage (Chained 2012 dollars) (3-31)
- Transportation Revenues by Mode and Level of Government (Current dollars) (3-32)
- Transportation Revenues by Mode and Level of Government (Chained 2012 dollars) (3-33)
- Cash Balances of the Transportation-Related Federal Trust Funds (3-34)
- Transportation Expenditures by Mode and Level of Government from Own Funds (Current dollars) (3-35)
- Transportation Expenditures by Mode and Level of Government from Own Funds (Chained 2012 dollars) (3-36)
- Federal Transportation Grants to State and Local Governments by Mode (Current dollars) (3-37)
- Federal Transportation Grants to State and Local Governments by Mode (Chained 2012 dollars) (3-38)
Transportation Energy Consumption by Mode
Transportation Energy Intensity and Fuel Efficiency
- Energy Intensity of Amtrak Services (4-26)
Air Pollution
- Estimated National Emissions of Carbon Monoxide (4-45)
- Estimated National Emissions of Nitrogen Oxides (4-46)
- Estimated National Emissions of Volatile Organic Compounds (4-47)
- Estimated National Emissions of Particulate Matter (PM-10) (4-48)
- Estimated National Emissions of Particulate Matter (PM-2.5) (4-49)
- Estimated National Emissions of Sulfur Dioxide (4-50)
Modal Profiles
Contact: Dave Smallen (202) 366-5568, david.smallen@dot.gov.