
North American Transborder Freight Data
Legacy ID
331
Show Effective Date
On
Significant Regulatory Guidance
No
2018 North American Transborder Freight Numbers
Transborder freight between the U.S. and other North American countries (Canada and Mexico) in 2018:
- Most-used mode: Truck moved $772 billion of freight, up 7.1 percent compared to 2017
- Second mode: Rail moved $179 billion of freight, up 2.7 percent compared to December 2017
December 2018 North American Transborder Freight Numbers
Transborder freight between the U.S. and other North American countries (Canada and Mexico) in December 2018:
- Most-used mode: Truck moved $57.4 billion of freight, up 1.0 percent compared to December 2017
- Second mode: Rail moved $14.2 billion of freight, up 4.1 percent compared to December 2017
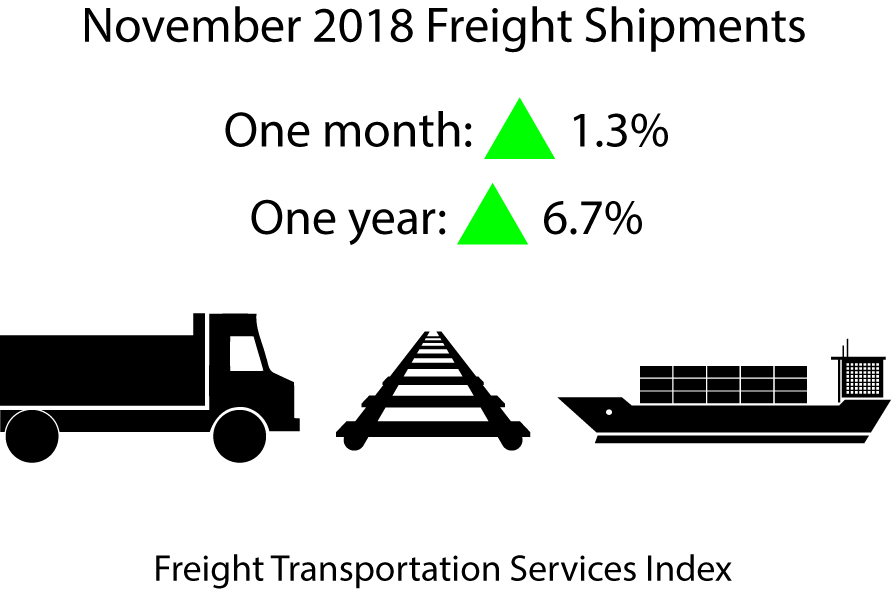
November 2018 Freight Transportation Services Index (TSI)
Release Number: BTS 01-19
Date: Wednesday, January 9, 2019
October 2018 North American Transborder Freight Numbers
Transborder freight between the U.S. and other North American countries (Canada and Mexico) in October 2018:
- Most-used mode: Truck moved $70.1 billion of freight, up 9.0 percent compared to October 2017
- Second mode: Rail moved $15.8 billion of freight, up 4.0 percent compared to October 2017
September 2018 North American Transborder Freight Numbers
Transborder freight between the U.S. and other North American countries (Canada and Mexico) in September 2018:
- Most-used mode: Truck moved $63.3 billion of freight, up 4.2 percent compared to September 2017
- Second mode: Rail moved $15.1 billion of freight, up 7.6 percent compared to September 2017
August 2018 North American Transborder Freight Numbers
Transborder freight between the U.S. and other North American countries (Canada and Mexico) in August 2018:
- Most-used mode: Truck moved $66.6 billion of freight, up 5.7 percent compared to August 2017
- Second mode: Rail moved $15.5 billion of freight, up 5.5 percent compared to August 2017