USA Banner

Official US Government Icon

Official websites use .gov
A .gov website belongs to an official government organization in the United States.

Secure Site Icon

Secure .gov websites use HTTPS
A lock ( ) or https:// means you’ve safely connected to the .gov website. Share sensitive information only on official, secure websites.

U.S. Department of Transportation U.S. Department of Transportation Icon United States Department of Transportation United States Department of Transportation

National Transportation Statistics 12/17/19 Update, Sales Price of Transportation Fuel and other categories

Tuesday, December 17, 2019

Tuesday, December 17, 2019 - National Transportation Statistics (NTS) – a guide to historical national-level transportation trends was updated today.
Recently Updated Tables by Topics:

Physical Extent

Estimated U.S. Roadway Lane-Miles by Functional System (1-6, 1-6M)
ADA Lift- or Ramp-Equipped Transit Buses (1-8)

Vehicle, Aircraft, and Vessel Inventory

Gasoline Hybrid and Electric Vehicle Sales (1-19)
Number and Size of the U.S. Flag Merchant Fleet and Its Share of the World Fleet (1-24)

Condition

Average Age of Automobiles and Trucks in Operation in the United States (1-26)
Condition of U.S. Roadways by Functional System (1-27)

Travel and Goods Movement

Principal Means of Transportation to Work (1-41)

System Performance

Annual Person-Hours of Highway Traffic Delay Per Auto Commuter (1-69)
Travel Time Index (1-70)
Annual Highway Congestion Cost (1-72)

Multimodal Safety

Injured Persons by Transportation Mode (2-2)

Highway Safety

Motor Vehicle Safety Data (2-17)
Motor Vehicle Fatalities, Vehicle-Miles, and Associated Rates by Highway Functional System (2-18)
Occupant Fatalities by Vehicle Type and Nonoccupant Fatalities (2-19)
Occupant and Nonmotorist Fatalities in Crashes by Number of Vehicles and Alcohol Involvement (2-20)
Motorcycle Rider Safety Data (2-22)

Water Safety

U.S. Coast Guard Search and Rescue Statistics (2-49)

Transportation and the Economy

U.S. Gross Domestic Product (GDP) by Major Social Function (3-9)

Transportation and Consumer Expenditures

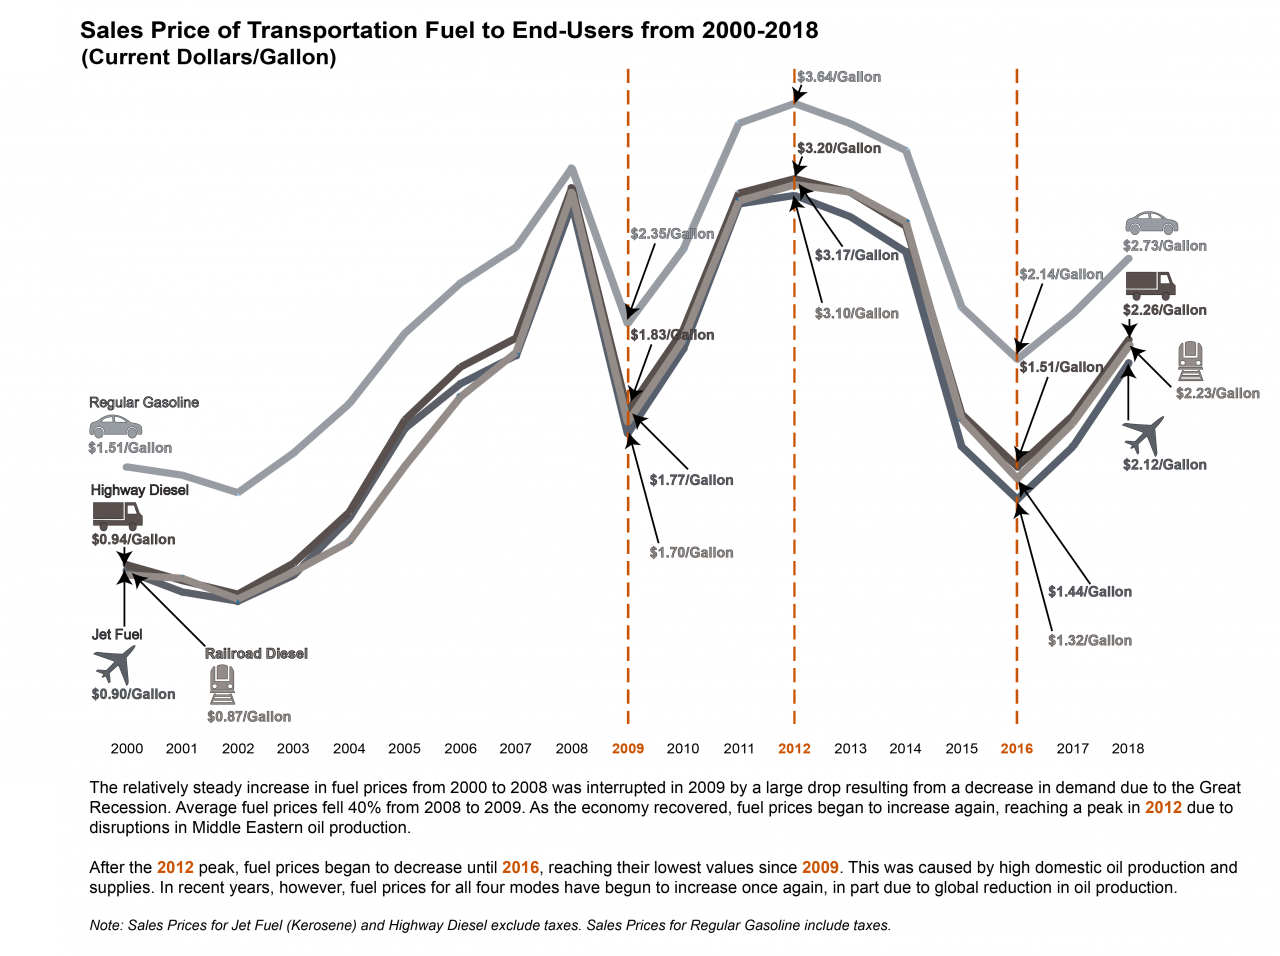
Sales Price of Transportation Fuel to End-Users (3-11)

Transportation Energy Intensity and Fuel Efficiency

Average Fuel Efficiency of U.S. Light Duty Vehicles (4-23, 4-23M)
Energy Intensity of Class I Railroad Freight Service (4-25, 4-25M)
Annual Wasted Fuel Due to Congestion (4-28)
Annual Wasted Fuel Per Person (4-29)

Air Pollution

Federal Exhaust Emissions Standards for Newly Manufactured Motorcycles (4-38)

Contact: Dave Smallen (202) 366-5568, david.smallen@dot.gov.