
National Transportation Statistics 10/30/19 Update, Passenger Enplanements at the Top 50 U.S. Airports and other categories
Wednesday, October 30, 2019
Wednesday, October 30, 2019 - National Transportation Statistics (NTS) – a guide to historical national-level transportation trends was updated today.
Note: For airport codes see NTS Table 1-44
Recently Updated Tables by Topics:
Physical Extent
- Estimated U.S. Roadway Lane-Miles by Functional System (1-6, 1-6M)
- Oil and Gas Pipeline Mileage (1-10)
Vehicle, Aircraft, and Vessel Inventory
Travel and Goods Movement
- Roadway Vehicle-Miles Traveled (VMT) and VMT per Lane-Mile by Functional Class (1-36, 1-36M)
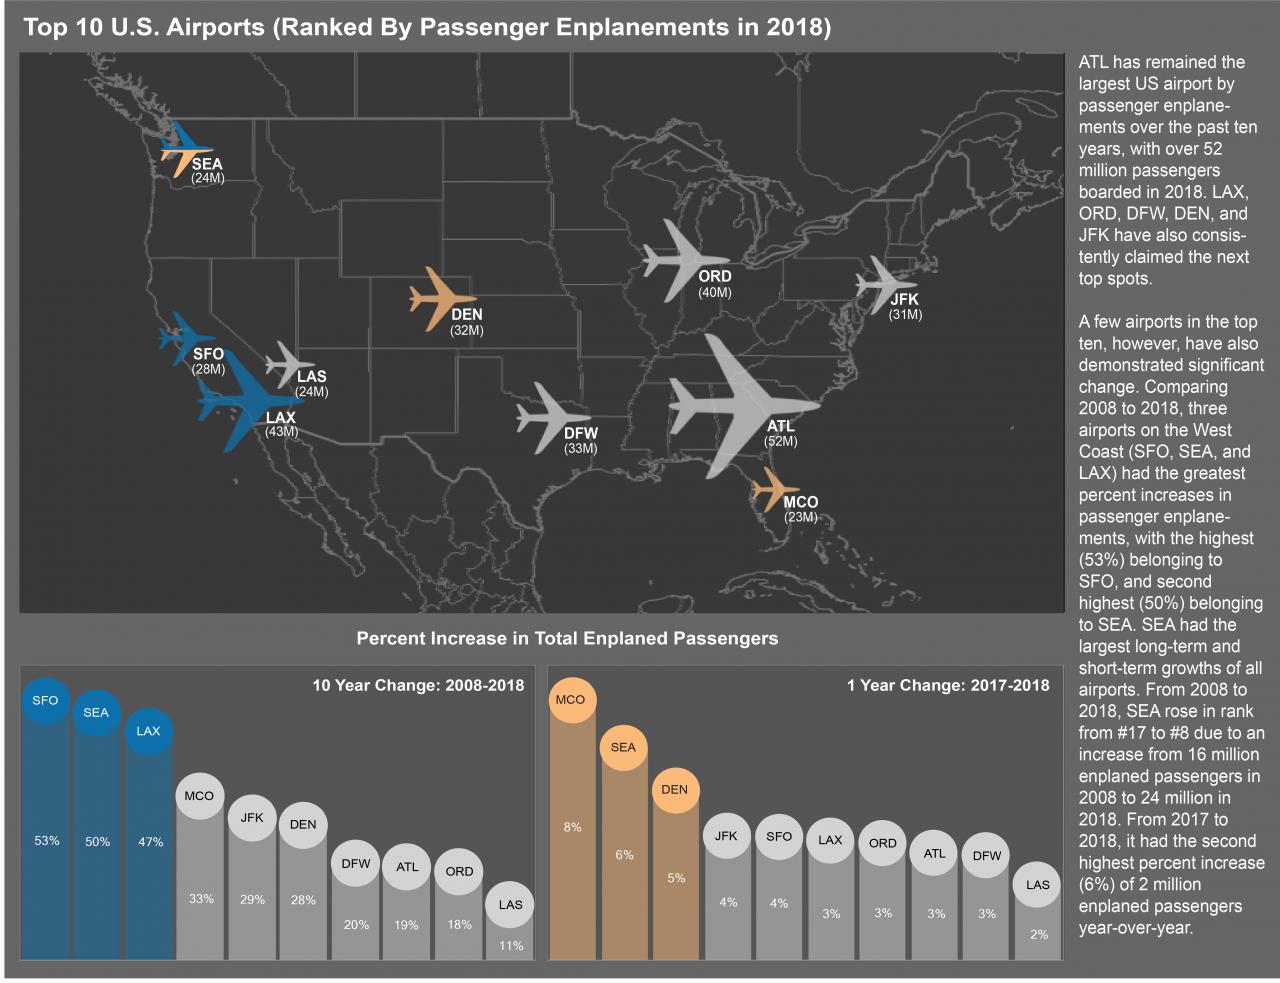
- Passengers Boarded at the Top 50 U.S. Airports (1-44)
Multimodal Safety
- Transportation Accidents by Mode (2-3)
- Highway-Rail Grade-Crossing Safety (2-5)
- Hazardous Materials Fatalities, Injuries, Accidents, and Property Damage Data (2-6)
Air Safety
- Air Carrier Safety Data (2-9)
- Commuter Air Carrier Safety Data (2-10)
- Air Carrier Fatal Accidents by Defining Event of Operation (2-11)
- Commuter Air Carrier Fatal Accidents by Defining Event of Operation (2-12)
- On-Demand Air Taxi Safety Data (2-13)
- General Aviation Safety Data (2-14)
Highway Safety
- Safety Belt and Motorcycle Helmet Use (2-30)
Pipeline Safety
- Hazardous Liquid and Natural Gas Pipeline Safety and Property Damage Data (2-50)
Transportation Revenues, Employment, and Productivity
- Average Freight Revenue Per Ton-mile (3-21)
- Total Operating Revenues (3-22)
- Employment in For-Hire Transportation and Selected Transportation-Related Industries (3-23)
Modal Profiles
Contact: Dave Smallen (202) 366-5568, david.smallen@dot.gov.