BTS Updates National Transportation Statistics with Sales Price of Transportation Fuels, Condition of U.S. Highway Bridges, Vehicle Miles Traveled, U.S. Air Carrier Delays & Cancellations, and Other Historical Tables
The Bureau of Transportation Statistics (BTS) today released its monthly update to National Transportation Statistics (NTS), a guide to historical transportation national-level transportation trends.
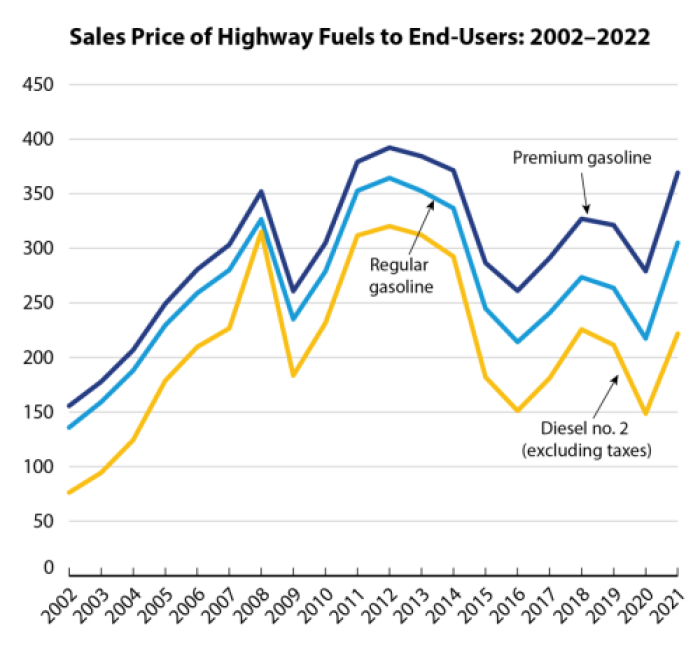
This month’s featured table, Sales Price of Transportation Fuel to End-Users, looks at the annual average price of aviation, highway, and railroad fuels in sales made to consumers as well as to bulk customers in agriculture, industry, and utilities from 1980 through 2021. Today’s release also features tables on the condition of U.S. highway bridges; employment in transportation and a wider range of transportation-related industries; U.S. vehicle-miles traveled; and major U.S. air carrier delays, cancellations, and diversions.

Recently Updated Tables by Topic:
Condition
Travel and Goods Movement
System Performance
- Passengers Boarded and Denied Boarding by the Largest U.S. Air Carriers (1-64)
- Baggage Mishandled by Marketing U.S. Air Carriers (1-65)
- Flight Operations Arriving On Time by the Largest U.S. Air Carriers (1-66)
- FAA-Cited Causes of Departure and En Route Delays (after pushing back from the gate) (1-67)
- Major U.S. Air Carrier Delays, Cancellations, and Diversions (1-68)
Multimodal Safety
- Highway-Rail Grade-Crossing Safety (2-5)
Highway Safety
- Motor Vehicle Safety Data (2-17)
- Motor Vehicle Fatalities, Vehicle-Miles, and Associated Rates by Highway Functional System (2-18)
- Occupant Fatalities by Vehicle Type and Nonoccupant Fatalities (2-19)
- Occupant and Non-Motorist Fatalities in Crashes by Number of Vehicles and Alcohol Involvement (2-20)
- Passenger Car Occupant Safety Data (2-21a)
- Work Zone Safety Data (2-21b)
- Motorcycle Rider Safety Data (2-22)
- Truck Occupant Safety Data (2-23)
- Bus Occupant Safety Data (2-24)
- Fatalities by Highest Blood Alcohol Concentration (BAC) in Highway Crashes (2-26)
- Motor Vehicle Fatal Crashes by Day of Week, Time of Day, and Weather and Light Conditions (2-28)
Railroad Safety
- Railroad and Grade-Crossing Fatalities by Victim Class (2-39)
- Railroad and Grade-Crossing Injured Persons by Victim Class (2-40)
- Train Fatalities, Injuries, and Accidents by Type of Accident (2-41)
- Railroad Passenger Safety Data (2-42)
- Railroad System Safety and Property Damage Data (2-43)
- Fatalities and Injuries of On-Duty Railroad Employees (2-44)
Transportation and the Economy
- U.S. Transportation and Economic Trends (3-10)
Transportation and Consumer Expenditures
- Sales Price of Transportation Fuel to End-Users (3-11)
- Producer Price Indices for Transportation Services and Warehousing Services (NAICS) (3-13)
- Producer Price Indices for Transportation Equipment (NAICS) (3-14)
- Personal Consumption Expenditures on Transportation by Subcategory (3-16)
Transportation Revenues, Employment, and Productivity
- Average Passenger Revenue per Passenger-Mile (3-20)
- Average Freight Revenue per Ton-Mile (3-21)
- Employment in For-Hire Transportation and Selected Transportation-Related Industries (NAICS) (3-23)
Transportation Energy Consumption by Mode
- Fuel Consumption by Mode of Transportation in Physical Units (4-5, 4-5M)
- Energy Consumption by Mode of Transportation (4-6, 4-6M)
- Class I Rail Freight Fuel Consumption and Travel (4-17, 4-17M)
- Amtrak Fuel Consumption and Travel (4-18, 4-18M)
Transportation Energy Intensity and Fuel Efficiency
Modal Profiles
