
BTS Updates National Transportation Statistics with Inbound Freight Crossings from Canada and Mexico, Motor Vehicle Fuel Consumption, Weekly Earnings of Transportation Workers, and Other Historical Tables
The Bureau of Transportation Statistics (BTS) today released its monthly update to National Transportation Statistics (NTS), a collection of annual transportation measures at the national level.
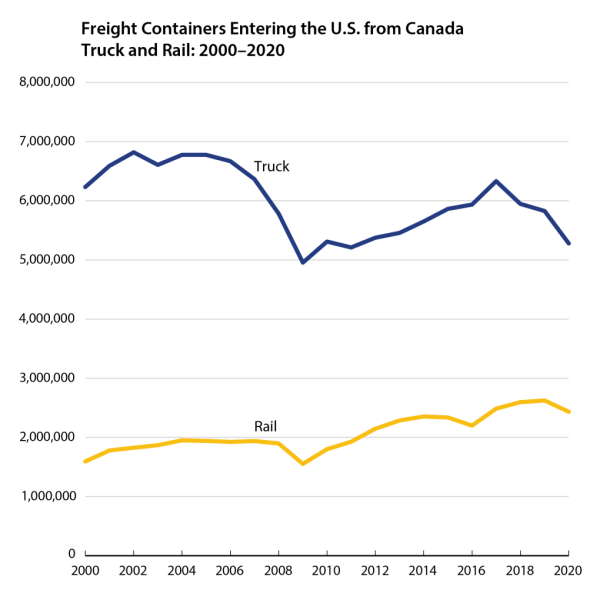
This month’s featured table, U.S.-Canadian Border Land-Freight Gateways: Number of Incoming Truck or Rail Container Crossings, looks at inbound freight activity along the Canadian border, the site of several recent truck blockades. The lines in the chart below show how the number of truck freight containers and rail freight containers coming into the U.S. from Canada has changed in the first two decades of this century. The February release also features tables on the condition of U.S. roadways; transportation-related occupational safety; the earnings of transportation workers; and vehicle fuel consumption in the U.S
Recently Updated Tables by Topics:
Physical Extent
- System Mileage Within the United States (1-1, 1-1M)
- Number of Air Carriers, Railroads, Interstate Motor Carriers, Marine Vessel Operators, and Pipeline Operators (1-2)
- Public Road and Street Mileage in the United States by Type of Surface (1-4, 1-4M)
Vehicle, Aircraft, and Vessel Inventory
- Number of U.S. Aircraft, Vehicles, Vessels, and Other Conveyances (1-11)
- U.S. Sales or Deliveries of New Aircraft, Vehicles, Vessels, and Other Conveyances (1-12)
- Retail Sales of New Cars by Sector (1-18)
Condition
- Condition of U.S. Roadways by Functional System (1-27)
- Condition of Urban Bus and Rail Transit Maintenance Facilities (1-30)
- U.S. Flag Vessels by Type and Age (1-34)
Travel and Goods Movement
- Average Length of Haul, Domestic Freight and Passenger Modes (1-38, 1-38M)
- U.S.-Canadian Border Land-Passenger Gateways: Entering the United States (1-47)
- U.S.-Mexican Border Land-Passenger Gateways: Entering the United States (1-48)
- U.S. Ton-Miles of Freight (1-50, 1-50M)
- U.S.-Canadian Border Land-Freight Gateways: Number of Incoming Truck or Rail Container Crossings (1-52)
- U.S.-Canadian Border Land-Freight Gateways: Number of Incoming Truck or Train Crossings (1-53)
- U.S.-Mexican Border Land-Freight Gateways: Number of Incoming Truck or Rail Container Crossings (1-54)
- U.S.-Mexican Border Land-Freight Gateways: Number of Incoming Truck and Train Crossings (1-55)
Multimodal Safety
- Transportation-Related Occupational Fatalities (2-7)
Pipeline Safety
- Hazardous Liquid and Natural Gas Pipeline Safety and Property Damage Data (2-50)
Transportation and Consumer Expenditures
- Price Trends of Gasoline v. Other Consumer Goods and Services (3-12)
- Personal Expenditures by Category (3-15)
Transportation Revenues, Employment, and Productivity
- Total Operating Revenues (3-22)
- Median Weekly Earnings of Full-Time Wage and Salary Workers in Transportation by Detailed Occupation (3-26)
Transportation Energy Consumption by Mode
- Motor Vehicle Fuel Consumption and Travel (4-9, 4-9M)
- Light Duty Vehicle, Short Wheel Base and Motorcycle Fuel Consumption and Travel (4-11, 4-11M)
- Light Duty Vehicle, Long Wheel Base Fuel Consumption and Travel (4-12, 4-12M)
- Single-Unit 2-Axle 6-Tire or More Truck Fuel Consumption and Travel (4-13, 4-13M)
- Combination Truck Fuel Consumption and Travel (4-14, 4-14M)
- Bus Fuel Consumption and Travel (4-15, 4-15M)
Transportation Energy Intensity and Fuel Efficiency
- Energy Intensity of Passenger Modes (4-20, 4-20M)
- Energy Intensity of Light Duty Vehicles and Motorcycles (4-22, 4-22M)
- Average Fuel Efficiency of U.S. Light Duty Vehicles (4-23, 4-23M)
Modal Profiles